

Wells Fargo shares weekly forecast: Failure to reclaim $79.76 resistance caps recovery prospects

Shares of Wells Fargo & Company (WFC) are trading near $79 after a sharp drop of roughly 5.5% last week, dragged lower by weak earnings momentum. With rebound odds still low, investors will be watching for stronger signals of stability or renewed pressure in the days ahead.
 84.63
84.63
84.63
84.63
Highlights
- Shares of Wells Fargo closed at $79, losing 5.53% over the past week and severely underperforming recent ranges.
- The stock trades below all major daily moving averages with sustained bearish momentum and no nearby support in place.
- Wells Fargo is projected to trade between $73.88 and $81.17 over the next five days with more than 80% probability of further downside.
Dividend hike and stablecoin push offset by earnings miss during the week
Wells Fargo reported third-quarter 2026 financial results on October 13, posting net income of approximately $6 billion and diluted earnings per share of $1.87, according to Yahoo Finance and TipRanks. Revenue came in at $21.87 billion, slightly below analyst expectations, and the company increased its quarterly dividend to $0.50 per share while repurchasing $2.5 billion of common stock during the period (sources: Seeking Alpha, GuruFocus). In parallel with the earnings release, Wells Fargo confirmed participation in a consortium of 20 banks planning a U.S. dollar-backed stablecoin launch in 2027, and also rolled out tokenized deposits for corporate and commercial clients (sources: Coin-Turk, FinanceFeeds).
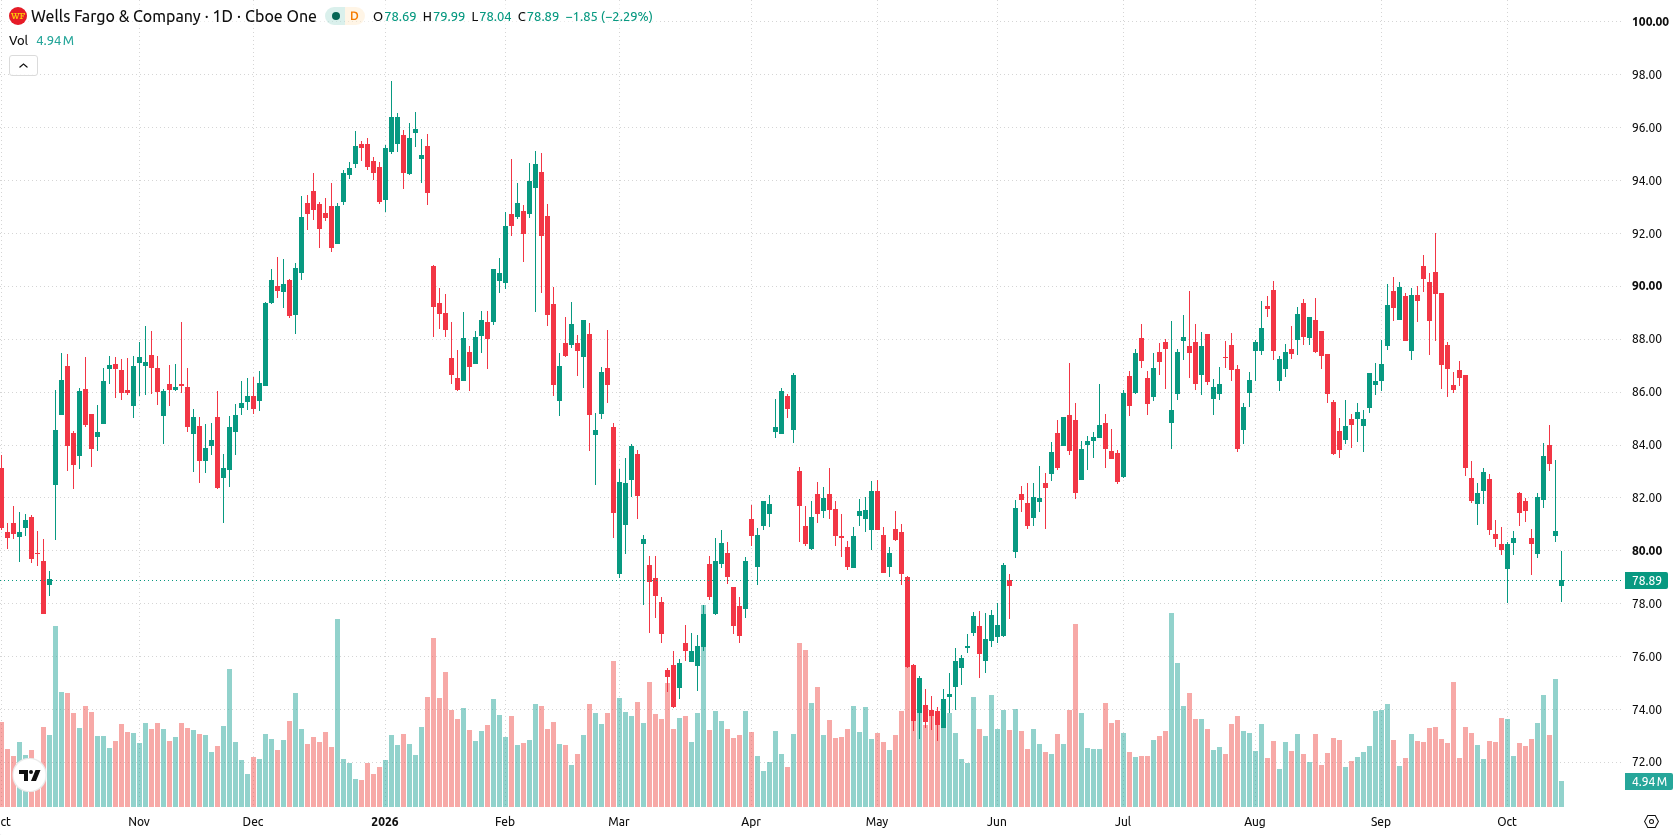
Bearish momentum intensifies as MACD signals strong sell over the week
On the daily chart, the picture is pressured by a contained move within a narrow range and volatility at 6.09%. Bearish momentum is underscored by the MACD in Strong Sell territory at -1.41, while the RSI at 40.38 remains neutral but leans toward the lower half of its range. Immediate resistance sits at $79.76, just above current prices, with the Ichimoku Kijun at $84.93 also acting as resistance and no nearby support in play. This setup reflects sustained selling pressure in the absence of bullish momentum signals, suggesting further downside risk if sellers retain control.
High downside risk persists as base case favors further consolidation
Over the next five trading days, Wells Fargo is expected to range between $73.88 and $81.17, with a very high probability (more than 80%) of a further decrease and a very low probability (less than 20%) of an uptick. The base case calls for continued consolidation just below resistance at $79.76. Should price reclaim this level, a move toward $84.93 becomes possible. If sellers force a decisive breakdown below $73.88, additional losses would likely follow.
Previously it was reported that Wells Fargo was under persistent selling pressure due to technical weakness and disappointing revenue figures. This latest analysis confirms the ongoing downside bias and highlights $73.88 as a critical support level to monitor for potential additional losses if selling momentum accelerates.




Latest Wells Fargo News




-
 Afghanistan
-
 Albania
-
 Algeria
-
 Angola
-
 Argentina
-
 Armenia
-
 Australia
-
 Austria
-
 Azerbaijan
-
 Bahamas
-
 Bahrain
-
 Bangladesh
-
 Belarus
-
 Belgium
-
 Bolivia
-
 Botswana
-
 Brazil
-
 Brunei
-
 Bulgaria
-
 Cambodia
-
 Cameroon
-
 Canada
-
 Chile
Chile
-
 China
China
-
 Colombia
-
 Congo
Congo
-
 Costa Rica
-
 Cote d'Ivoire
-
 Croatia
-
 Cuba
Cuba
-
 Cyprus
-
 Czechia
-
 DR Congo
-
 Denmark
-
 Dominican Republic
-
 Ecuador
-
 Egypt
Egypt
-
 El Salvador
-
 Estonia
-
 Eswatini
-
 Ethiopia
-
 Finland
-
 France
-
 Georgia
-
 Germany
-
 Ghana
Ghana
-
 Greece
-
 Haiti
Haiti
-
 Hong Kong
-
 Hungary
-
 India
India
-
 Indonesia
-
 Iran, Islamic republic
-
 Iraq
Iraq
-
 Ireland
-
 Israel
-
 Italy
Italy
-
 Jamaica
-
 Japan
Japan
-
 Jordan
-
 Kazakhstan
-
 Kenya
Kenya
-
 Korea
Korea
-
 Kuwait
-
 Kyrgyzstan
-
 Laos
Laos
-
 Latvia
-
 Lebanon
-
 Lesotho
-
 Libya
Libya
-
 Lithuania
-
 Luxembourg
-
 Madagascar
-
 Malaysia
-
 Malta
Malta
-
 Mauritius
-
 Mexico
-
 Moldova
-
 Mongolia
-
 Montenegro
-
 Morocco
-
 Mozambique
-
 Myanmar
-
 Namibia
-
 Nepal
Nepal
-
 Netherlands
-
 New Zealand
-
 Nigeria
-
 North Macedonia
-
 Norway
-
 Oman
Oman
-
 Pakistan
-
 Palestine
-
 Panama
-
 Papua New Guinea
-
 Paraguay
-
 Peru
Peru
-
 Philippines
-
 Poland
-
 Portugal
-
 Puerto Rico
-
 Qatar
Qatar
-
 Reunion
-
 Romania
-
 Rwanda
-
 Saudi Arabia
-
 Serbia
-
 Singapore
-
 Slovakia
-
 Slovenia
-
 Somalia
-
 South Africa
-
 Spain
Spain
-
 Sri Lanka
-
 Sweden
-
 Switzerland
-
 Syria
Syria
-
 Taiwan
-
 Tajikistan
-
 Tanzania
-
 Thailand
-
 Trinidad and Tobago
-
 Tunisia
-
 Turkey
-
 UAE
UAE
-
 Uganda
-
 Ukraine
-
 United Kingdom
-
United States
-
 Uruguay
-
 Uzbekistan
-
 Venezuela
-
 Vietnam
-
 Yemen
Yemen
-
 Zambia
-
 Zimbabwe
- Forex
- Crypto












