

What's behind Wells Fargo's latest 2.2% stock pullback?

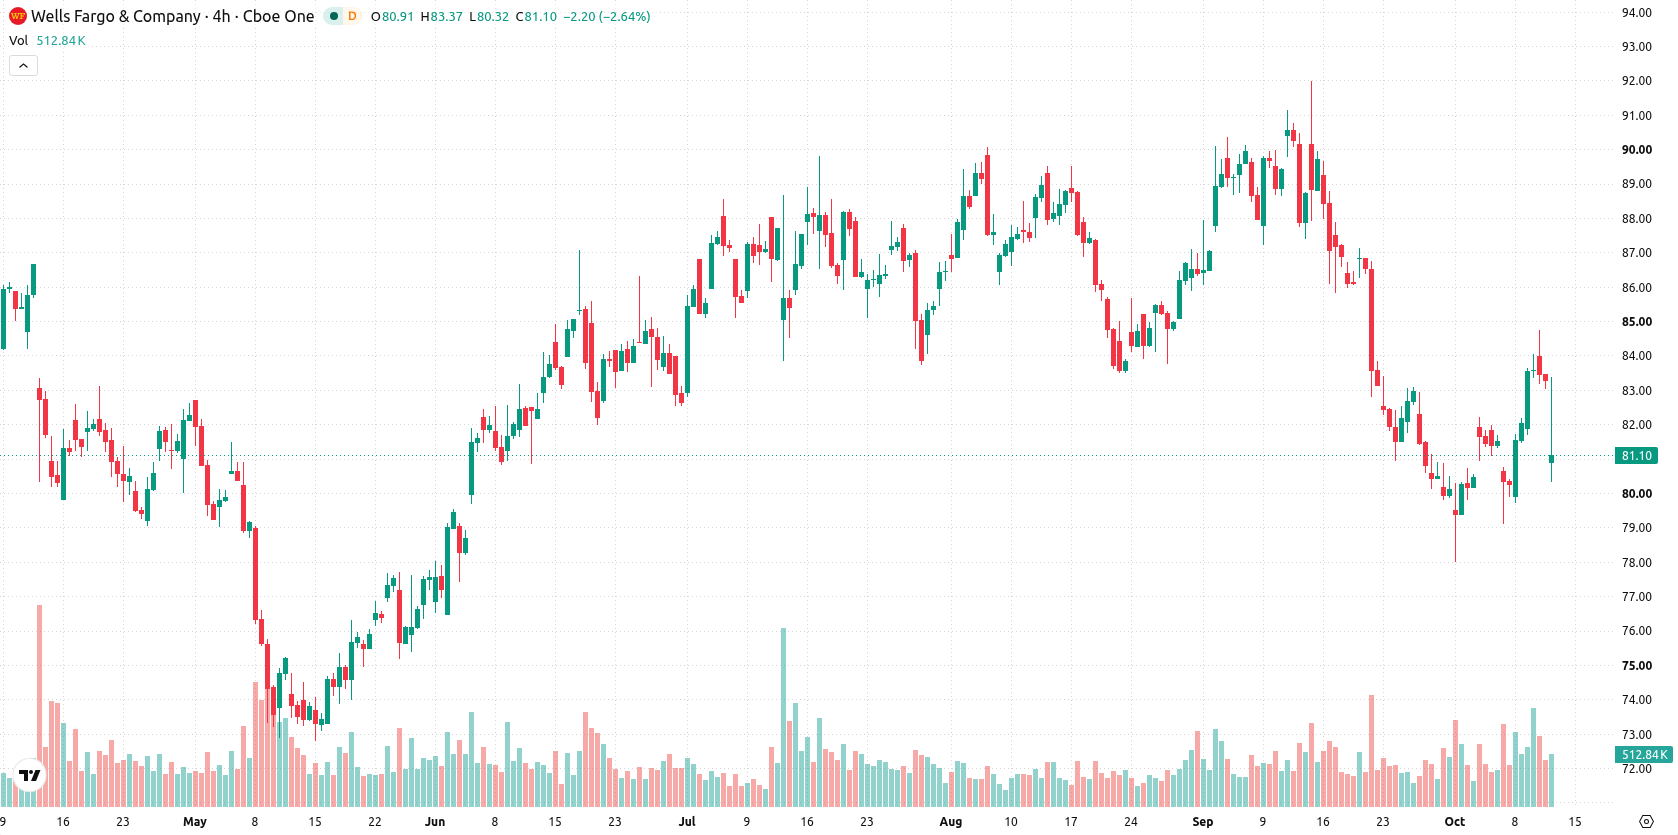
Wells Fargo & Company (WFC) declined 2.16% after reporting third quarter 2026 revenue below market expectations, with the miss acting as the main driver for today's selling pressure. The move is supported by the stock remaining below all key moving averages, indicating persistent technical weakness.
 83.30
84.62
83.30
84.62
Highlights
- Wells Fargo stock reported third quarter 2026 earnings per share of $1.87, narrowly above consensus expectations.
- Revenue reached $21.87 billion, below analyst forecasts, as net interest income and guidance remained steady with a $6.0 billion net income.
- Shares trade below key moving averages under broad selling pressure, with a projected five-day range of $79 to $84 and a 61% probability of a downward move.
Market pressure persists as earnings beat but revenue disappoints
Wells Fargo reported its third quarter 2026 earnings on October 13, 2026, posting earnings per share of $1.87, slightly above consensus estimates. Quarterly revenue reached $21.87 billion, which fell short of analyst expectations. Net interest income and guidance remained stable, and the company reported a net income of $6.0 billion along with a maintained dividend yield, though price action has remained under broader selling pressure.
Conflicting momentum as buyers compete with broad technical resistance
Wells Fargo is trading below its 20-day ($83.04), 50-day ($85.69), and 200-day ($84.42) moving averages, reflecting broad short-, medium-, and long-term pressure from sellers. The stock's closest resistance stands at $83.04, with immediate support situated at $79.62. The long-term trend context remains bullish given the alignment of the MA-50 above the MA-200. Momentum indicators show mixed signals: the MACD points to strong selling pressure, while the ADX sits at a neutral reading, suggesting an indecisive trend. The RSI is neutral but leaning toward a sell, and the Stochastic RSI is highly overbought. CCI and Awesome Oscillator both remain neutral. Bull/Bear Power is positive at 2.31, indicating buyers are dominating intraday, yet it is overbought, highlighting risk of a reversal. The stock has declined by $1.8 or 2.16% on the day after opening with an upside gap of about $0.9 (1.08%), and is now trading near session lows. Intraday volatility stands at 1.90%. The immediate tone is one of pressure after the open, with conflicting signals between strong near-term selling momentum and intraday buyer dominance.
Earlier, analysts noted that Wells Fargo was under sustained selling pressure, with technical indicators highlighting a strong bearish trend despite ongoing business initiatives. The latest earnings-driven decline and continued technical weakness reinforce the downside bias, making the $79.62 support level critical to monitor for signs of further risk in the near term.





Latest Wells Fargo News




-
 Afghanistan
-
 Albania
-
 Algeria
-
 Angola
-
 Argentina
-
 Armenia
-
 Australia
-
 Austria
-
 Azerbaijan
-
 Bahamas
-
 Bahrain
-
 Bangladesh
-
 Belarus
-
 Belgium
-
 Bolivia
-
 Botswana
-
 Brazil
-
 Brunei
-
 Bulgaria
-
 Cambodia
-
 Cameroon
-
 Canada
-
 Chile
Chile
-
 China
China
-
 Colombia
-
 Congo
Congo
-
 Costa Rica
-
 Cote d'Ivoire
-
 Croatia
-
 Cuba
Cuba
-
 Cyprus
-
 Czechia
-
 DR Congo
-
 Denmark
-
 Dominican Republic
-
 Ecuador
-
 Egypt
Egypt
-
 El Salvador
-
 Estonia
-
 Eswatini
-
 Ethiopia
-
 Finland
-
 France
-
 Georgia
-
 Germany
-
 Ghana
Ghana
-
 Greece
-
 Haiti
Haiti
-
 Hong Kong
-
 Hungary
-
 India
India
-
 Indonesia
-
 Iran, Islamic republic
-
 Iraq
Iraq
-
 Ireland
-
 Israel
-
 Italy
Italy
-
 Jamaica
-
 Japan
Japan
-
 Jordan
-
 Kazakhstan
-
 Kenya
Kenya
-
 Korea
Korea
-
 Kuwait
-
 Kyrgyzstan
-
 Laos
Laos
-
 Latvia
-
 Lebanon
-
 Lesotho
-
 Libya
Libya
-
 Lithuania
-
 Luxembourg
-
 Madagascar
-
 Malaysia
-
 Malta
Malta
-
 Mauritius
-
 Mexico
-
 Moldova
-
 Mongolia
-
 Montenegro
-
 Morocco
-
 Mozambique
-
 Myanmar
-
 Namibia
-
 Nepal
Nepal
-
 Netherlands
-
 New Zealand
-
 Nigeria
-
 North Macedonia
-
 Norway
-
 Oman
Oman
-
 Pakistan
-
 Palestine
-
 Panama
-
 Papua New Guinea
-
 Paraguay
-
 Peru
Peru
-
 Philippines
-
 Poland
-
 Portugal
-
 Puerto Rico
-
 Qatar
Qatar
-
 Reunion
-
 Romania
-
 Rwanda
-
 Saudi Arabia
-
 Serbia
-
 Singapore
-
 Slovakia
-
 Slovenia
-
 Somalia
-
 South Africa
-
 Spain
Spain
-
 Sri Lanka
-
 Sweden
-
 Switzerland
-
 Syria
Syria
-
 Taiwan
-
 Tajikistan
-
 Tanzania
-
 Thailand
-
 Trinidad and Tobago
-
 Tunisia
-
 Turkey
-
 UAE
UAE
-
 Uganda
-
 Ukraine
-
 United Kingdom
-
United States
-
 Uruguay
-
 Uzbekistan
-
 Venezuela
-
 Vietnam
-
 Yemen
Yemen
-
 Zambia
-
 Zimbabwe
- Forex
- Crypto












