


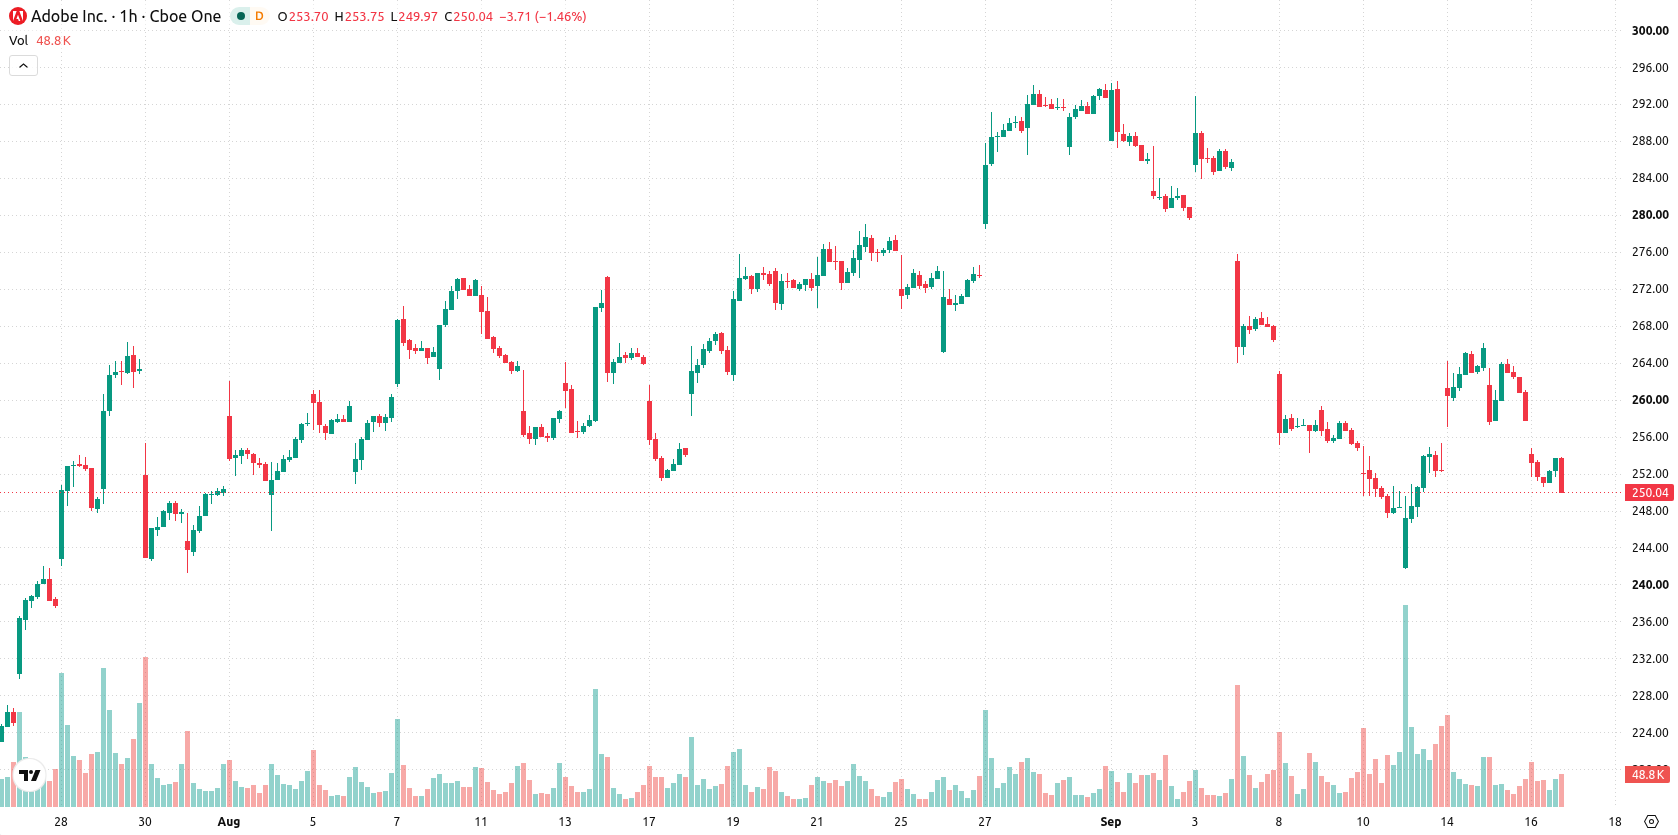
Adobe (ADBE) stock is trading at $249.9 after a daily decline of 3.05%, ending the session below its key moving averages.
 257.14
262.26
Highlights
- Adobe reported fiscal third-quarter revenue of $6.76 billion, a 13% increase over the same period last year.
- Non-GAAP diluted earnings per share rose 15% to $6.13, but remaining performance obligations growth slowed to 8% year over year.
- Shares of Adobe trade below key moving averages with a 71% probability of moving lower, and an expected near-term range of $239.17 to $260.63.
Earnings growth met by slowdown in recurring revenue momentum
Adobe's fiscal third-quarter results showed revenue rising to $6.76 billion, a 13% increase year over year, according to Finance Yahoo. Non-GAAP diluted earnings per share also improved by 15% to $6.13, underscoring stronger profitability in the quarter. However, growth in remaining performance obligations slowed to 8% year over year compared to 13% in the previous quarter, indicating moderated forward recurring-revenue momentum.
Mixed momentum and oversold signals as support levels tested
On the hourly chart, ADBE is trading below its MA-20 at $259.18 and MA-50 at $257.85, as well as below the long-term MA-200 at $266.01. The Ichimoku Kijun currently sits at $253.81, marking the nearest resistance. Momentum signals are mixed: MACD registers strong buy momentum, while ADX indicates ongoing selling pressure. Intraday readings for RSI at 40.02, Stoch RSI, CCI, and Bull/Bear Power all show oversold conditions with seller dominance. The Awesome Oscillator is neutral, and price action confirms proximity to session lows amid subdued volatility.
Downside risk dominates as breakout levels define short-term range
In the short term, ADBE is expected to trade within a range of $239.17 to $260.63, reflecting the typical volatility band relative to current levels. There is a 29% probability of a rebound to the upside, while the likelihood of a further move lower stands at 71%. The base-case scenario suggests continued sideways action within this corridor, with a break above $253.81 required to initiate a bullish trend and a move below $239.17 likely confirming additional downside.
Earlier, analysts noted that despite Adobe's strong operational results, technical momentum remained weak and near-term downside risks were elevated. The latest session confirms ongoing seller dominance and subdued volatility, with $239.17 identified as the critical downside level that traders should monitor for further price deterioration.









-
 Afghanistan
-
 Albania
-
 Algeria
-
 Angola
-
 Argentina
-
 Armenia
-
 Australia
-
 Austria
-
 Azerbaijan
-
 Bahamas
-
 Bahrain
-
 Bangladesh
-
 Belarus
-
 Belgium
-
 Bolivia
-
 Botswana
-
 Brazil
-
 Brunei
-
 Bulgaria
-
 Cambodia
-
 Cameroon
-
 Canada
-
 Chile
-
 China
-
 Colombia
-
 Congo
-
 Costa Rica
-
 Cote d'Ivoire
-
 Croatia
-
 Cuba
-
 Cyprus
-
 Czechia
-
 DR Congo
-
 Denmark
-
 Dominican Republic
-
 Ecuador
-
 Egypt
-
 El Salvador
-
 Estonia
-
 Eswatini
-
 Ethiopia
-
 Finland
-
 France
-
 Georgia
-
 Germany
-
 Ghana
-
 Greece
-
 Haiti
-
 Hong Kong
-
 Hungary
-
 India
-
 Indonesia
-
 Iran, Islamic republic
-
 Iraq
-
 Ireland
-
 Israel
-
 Italy
-
 Jamaica
-
 Japan
-
 Jordan
-
 Kazakhstan
-
 Kenya
-
 Korea
-
 Kuwait
-
 Kyrgyzstan
-
 Laos
-
 Latvia
-
 Lebanon
-
 Lesotho
-
 Libya
-
 Lithuania
-
 Luxembourg
-
 Madagascar
-
 Malaysia
-
 Malta
-
 Mauritius
-
 Mexico
-
 Moldova
-
 Mongolia
-
 Montenegro
-
 Morocco
-
 Mozambique
-
 Myanmar
-
 Namibia
-
 Nepal
-
 Netherlands
-
 New Zealand
-
 Nigeria
-
 North Macedonia
-
 Norway
-
 Oman
-
 Pakistan
-
 Palestine
-
 Panama
-
 Papua New Guinea
-
 Paraguay
-
 Peru
-
 Philippines
-
 Poland
-
 Portugal
-
 Puerto Rico
-
 Qatar
-
 Reunion
-
 Romania
-
 Rwanda
-
 Saudi Arabia
-
 Serbia
-
 Singapore
-
 Slovakia
-
 Slovenia
-
 Somalia
-
 South Africa
-
 Spain
-
 Sri Lanka
-
 Sweden
-
 Switzerland
-
 Syria
-
 Taiwan
-
 Tajikistan
-
 Tanzania
-
 Thailand
-
 Trinidad and Tobago
-
 Tunisia
-
 Turkey
-
 UAE
-
 Uganda
-
 Ukraine
-
 United Kingdom
-
United States
-
 Uruguay
-
 Uzbekistan
-
 Venezuela
-
 Vietnam
-
 Yemen
-
 Zambia
-
 Zimbabwe
- Forex
- Crypto












