

Nano Dimension stock support test at $1.54: Technical outlook

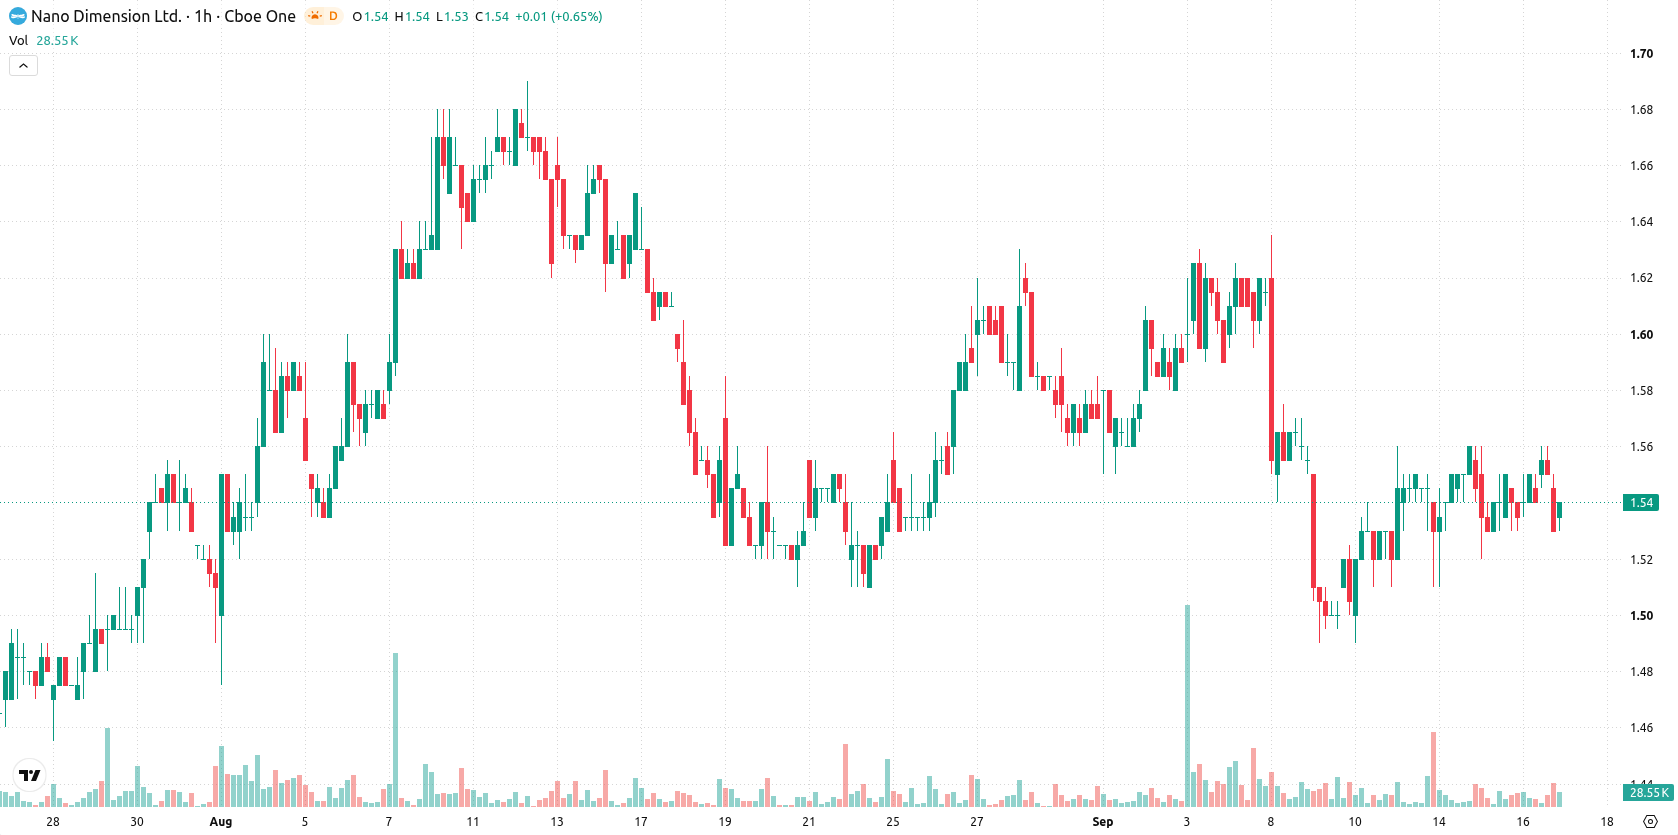
Nano Dimension (NNDM) stock is trading at $1.54 after a modest gain on the session. The stock sits above its key short- and medium-term moving averages, indicating some stability in the near term.
 1.28
1.38
Highlights
- NNDM/USD trades above short- and medium-term moving averages but remains under long-term resistance, indicating ongoing bearish pressure.
- Momentum indicators are mixed but mostly bearish intraday, with only the MACD supporting buying interest as other signals favor sellers.
- The price is expected to remain in the $1.5 to $1.58 range over the next 2 to 3 days, with a greater risk of a move lower.
Mixed momentum as intraday indicators contradict technical support
On the H1 timeframe, NNDM is positioned above the MA-20 and MA-50, while remaining below the MA-200 on the daily chart. The Ichimoku Kijun at $1.54 offers immediate support, aligning closely with the current price. MACD currently signals continued buying activity, but this is contradicted by the ADX, RSI, Stoch RSI, CCI, and Bull/Bear Power, which all indicate prevailing sell-side momentum on an intraday basis. The presence of a minor upward gap and moderate volatility, coupled with these mixed signals, highlights a lack of strong conviction behind the current movement.
Downside bias as breakout risk remains subdued
Over the next two to three trading days, NNDM is expected to remain confined to a typical volatility band between $1.5 and $1.58. The probability of a significant upward breakout is very low, while a downward move is highly likely. If the price closes above resistance, such a move would point to a bullish reversal; conversely, a decisive break below support would reinforce the bearish scenario, but sideways activity is the baseline expectation.
Earlier, analysts noted that Nano Dimension was experiencing sustained bearish momentum with limited signs of reversal. The current technical setup adds nuance to this view by depicting a mixed short-term picture, and traders should closely monitor for a confirmed break above or below the prevailing volatility band as the next directional signal.






Latest Nano Dimension News




-
 Afghanistan
-
 Albania
-
 Algeria
-
 Angola
-
 Argentina
-
 Armenia
-
 Australia
-
 Austria
-
 Azerbaijan
-
 Bahamas
-
 Bahrain
-
 Bangladesh
-
 Belarus
-
 Belgium
-
 Bolivia
-
 Botswana
-
 Brazil
-
 Brunei
-
 Bulgaria
-
 Cambodia
-
 Cameroon
-
 Canada
-
 Chile
-
 China
-
 Colombia
-
 Congo
-
 Costa Rica
-
 Cote d'Ivoire
-
 Croatia
-
 Cuba
-
 Cyprus
-
 Czechia
-
 DR Congo
-
 Denmark
-
 Dominican Republic
-
 Ecuador
-
 Egypt
-
 El Salvador
-
 Estonia
-
 Eswatini
-
 Ethiopia
-
 Finland
-
 France
-
 Georgia
-
 Germany
-
 Ghana
-
 Greece
-
 Haiti
-
 Hong Kong
-
 Hungary
-
 India
-
 Indonesia
-
 Iran, Islamic republic
-
 Iraq
-
 Ireland
-
 Israel
-
 Italy
-
 Jamaica
-
 Japan
-
 Jordan
-
 Kazakhstan
-
 Kenya
-
 Korea
-
 Kuwait
-
 Kyrgyzstan
-
 Laos
-
 Latvia
-
 Lebanon
-
 Lesotho
-
 Libya
-
 Lithuania
-
 Luxembourg
-
 Madagascar
-
 Malaysia
-
 Malta
-
 Mauritius
-
 Mexico
-
 Moldova
-
 Mongolia
-
 Montenegro
-
 Morocco
-
 Mozambique
-
 Myanmar
-
 Namibia
-
 Nepal
-
 Netherlands
-
 New Zealand
-
 Nigeria
-
 North Macedonia
-
 Norway
-
 Oman
-
 Pakistan
-
 Palestine
-
 Panama
-
 Papua New Guinea
-
 Paraguay
-
 Peru
-
 Philippines
-
 Poland
-
 Portugal
-
 Puerto Rico
-
 Qatar
-
 Reunion
-
 Romania
-
 Rwanda
-
 Saudi Arabia
-
 Serbia
-
 Singapore
-
 Slovakia
-
 Slovenia
-
 Somalia
-
 South Africa
-
 Spain
-
 Sri Lanka
-
 Sweden
-
 Switzerland
-
 Syria
-
 Taiwan
-
 Tajikistan
-
 Tanzania
-
 Thailand
-
 Trinidad and Tobago
-
 Tunisia
-
 Turkey
-
 UAE
-
 Uganda
-
 Ukraine
-
 United Kingdom
-
United States
-
 Uruguay
-
 Uzbekistan
-
 Venezuela
-
 Vietnam
-
 Yemen
-
 Zambia
-
 Zimbabwe
- Forex
- Crypto












