

Morgan Stanley shares remain pressured as recovery falters below resistance: weekly analysis

Shares of Morgan Stanley (MS) are trading near $202 after slipping nearly 6% over the past week, as momentum tilts sharply negative and oversold signals emerge on the chart. A lack of sustained recovery continues to keep downside pressure in play for the days ahead, with technical readings resembling a stretched decline.
 183.55
193.19
183.55
193.19
Highlights
- Shares of Morgan Stanley fell 5.7% over the past week, ending at $202.16 with momentum pointing lower.
- The stock trades below both its 20-day and 50-day moving averages, indicating a sustained bearish short-term structure.
- The next five days are expected to see shares move between $194.45 and $209.86, with a 73% chance of further decline and key support at $200.4.
Innovation and social impact initiatives draw little short-term investor response
Morgan Stanley announced its selection of 20 startups for its 2026 global cohort, with each startup receiving a $150,000 equity investment, while four nonprofits will also benefit from grants and mentorship, according to stocktitan.net. This initiative highlights MS's ongoing efforts in innovation and social impact capital, yet is not expected to materially shift investor sentiment in the short term.
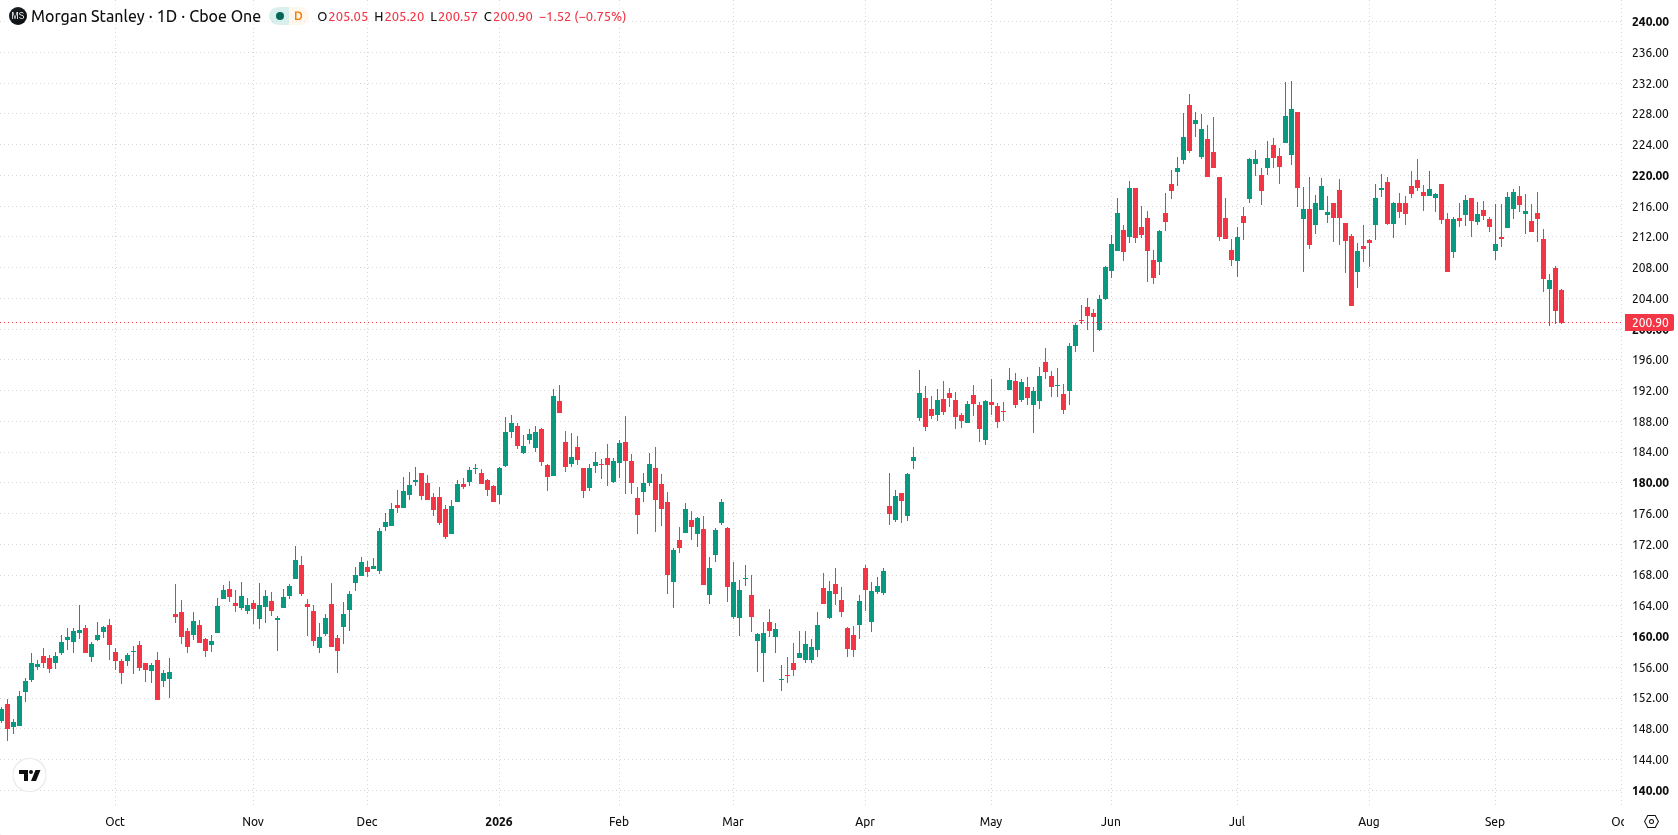
Downside momentum intensifies as volatility spikes and support is tested
The daily chart shows a sharp move lower without a sustained trend, with 7-day volatility at 8.6%. Momentum is tilted to the downside, as signaled by a CCI reading deep in the oversold zone at -237.33 and Stochastic RSI pinned to zero. The nearest support is at $200.4, while resistance aligns with the Ichimoku Kijun at $211.2. This combination keeps the setup vulnerable to further downside, though an oversold backdrop could support a temporary bounce.
Consolidation seen likely as downside bias dominates next week
For the next five trading days, Morgan Stanley is expected to trade between $194.45 and $209.86. There is a 73% probability of a decrease versus 27% for an advance, as the provider’s direction remains down. The base case is consolidation within the $194.45–$209.86 range. A decisive move above $211.2 would shift the short-term picture more positive, while a break below $200.4 opens the door to further losses toward the lower boundary of the expected range.
Earlier, analysts noted that Morgan Stanley was exhibiting downside momentum with persistent technical pressures limiting the likelihood of a near-term rebound. The latest readings reinforce this prevailing scenario, highlighting $200.4 as the critical support level to monitor as price action remains vulnerable to further declines within the established range.





Latest Morgan Stanley News





-
 Afghanistan
-
 Albania
-
 Algeria
-
 Angola
-
 Argentina
-
 Armenia
-
 Australia
-
 Austria
-
 Azerbaijan
-
 Bahamas
-
 Bahrain
-
 Bangladesh
-
 Belarus
-
 Belgium
-
 Bolivia
-
 Botswana
-
 Brazil
-
 Brunei
-
 Bulgaria
-
 Cambodia
-
 Cameroon
-
 Canada
-
 Chile
Chile
-
 China
China
-
 Colombia
-
 Congo
Congo
-
 Costa Rica
-
 Cote d'Ivoire
-
 Croatia
-
 Cuba
Cuba
-
 Cyprus
-
 Czechia
-
 DR Congo
-
 Denmark
-
 Dominican Republic
-
 Ecuador
-
 Egypt
Egypt
-
 El Salvador
-
 Estonia
-
 Eswatini
-
 Ethiopia
-
 Finland
-
 France
-
 Georgia
-
 Germany
-
 Ghana
Ghana
-
 Greece
-
 Haiti
Haiti
-
 Hong Kong
-
 Hungary
-
 India
India
-
 Indonesia
-
 Iran, Islamic republic
-
 Iraq
Iraq
-
 Ireland
-
 Israel
-
 Italy
Italy
-
 Jamaica
-
 Japan
Japan
-
 Jordan
-
 Kazakhstan
-
 Kenya
Kenya
-
 Korea
Korea
-
 Kuwait
-
 Kyrgyzstan
-
 Laos
Laos
-
 Latvia
-
 Lebanon
-
 Lesotho
-
 Libya
Libya
-
 Lithuania
-
 Luxembourg
-
 Madagascar
-
 Malaysia
-
 Malta
Malta
-
 Mauritius
-
 Mexico
-
 Moldova
-
 Mongolia
-
 Montenegro
-
 Morocco
-
 Mozambique
-
 Myanmar
-
 Namibia
-
 Nepal
Nepal
-
 Netherlands
-
 New Zealand
-
 Nigeria
-
 North Macedonia
-
 Norway
-
 Oman
Oman
-
 Pakistan
-
 Palestine
-
 Panama
-
 Papua New Guinea
-
 Paraguay
-
 Peru
Peru
-
 Philippines
-
 Poland
-
 Portugal
-
 Puerto Rico
-
 Qatar
Qatar
-
 Reunion
-
 Romania
-
 Rwanda
-
 Saudi Arabia
-
 Serbia
-
 Singapore
-
 Slovakia
-
 Slovenia
-
 Somalia
-
 South Africa
-
 Spain
Spain
-
 Sri Lanka
-
 Sweden
-
 Switzerland
-
 Syria
Syria
-
 Taiwan
-
 Tajikistan
-
 Tanzania
-
 Thailand
-
 Trinidad and Tobago
-
 Tunisia
-
 Turkey
-
 UAE
UAE
-
 Uganda
-
 Ukraine
-
 United Kingdom
-
United States
-
 Uruguay
-
 Uzbekistan
-
 Venezuela
-
 Vietnam
-
 Yemen
Yemen
-
 Zambia
-
 Zimbabwe
- Forex
- Crypto












