


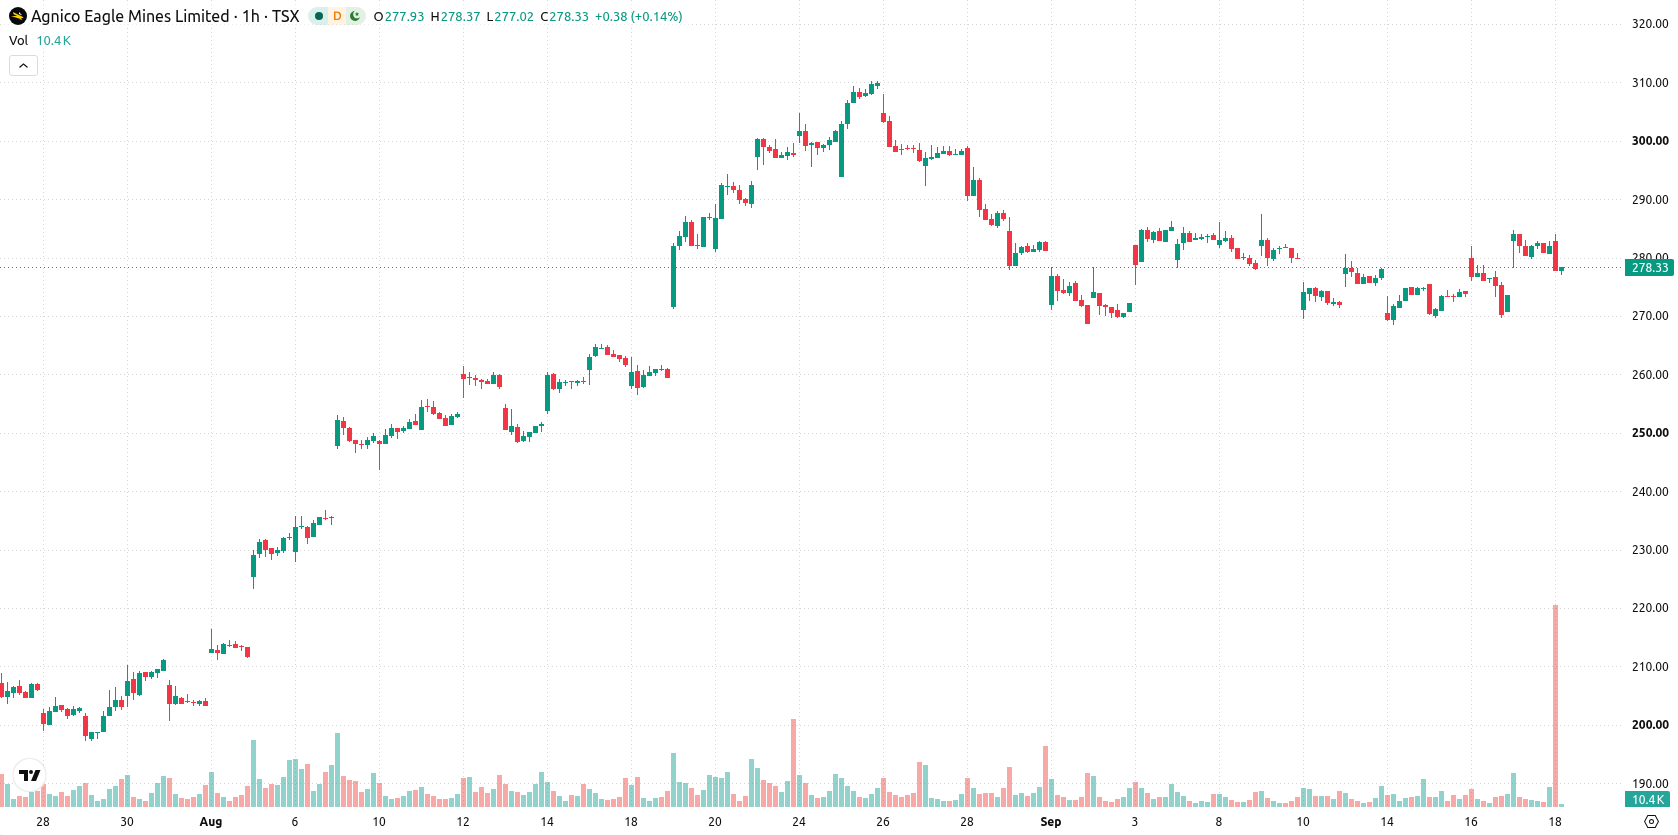
Agnico Eagle Mines (AEM) stock is trading at C$277.36, down 1.7% for the day and closing near the session low. The price remains above its key moving averages, indicating support remains intact on both short- and long-term timeframes.
 270.75
Highlights
- Agnico Eagle Mines reported adjusted earnings of $3.05 per share, surpassing the $2.89 consensus estimate and growing revenue 35% year over year.
- The company is not participating in Barrick Mining Corporation's proposed North American IPO and will maintain selective capital deployment in critical minerals and its own growth strategy.
- Agnico Eagle Mines stock is supported by strong technical indicator signals with short-term price projected to range from C$270.22 to C$284.5, with no clear directional bias.
Earnings beat and selective strategy drive divergence in sentiment
Agnico Eagle Mines reported adjusted earnings of $3.05 per share for the latest quarter, exceeding the $2.89 consensus estimate, with revenue climbing 35% year over year, according to Americanbankingnews. This outperformance reflects strong operational execution and ongoing demand for the company’s mining output. Additionally, Agnico Eagle Mines has opted to forgo involvement in Barrick Mining Corporation’s proposed North American IPO, instead maintaining a selective focus on critical mineral investments and its proprietary growth strategy as reported by Benzinga. These positive corporate developments have unfolded even as price action has remained under broader selling pressure.
Technical buy signals persist as overbought readings meet stable support
On the hourly chart, AEM trades above the MA-20 at C$276.91 and MA-50 at C$276.37, while on the daily timeframe it remains above the MA-200 at C$259.96. The Ichimoku Kijun line at C$277.16 acts as immediate support. Momentum readings show RSI, Stochastic RSI, and CCI in Buy territory, and MACD also signals Buy. However, ADX remains Neutral, and Bull/Bear Power is Overbought, indicating prevailing buyer pressure intraday despite moderate volatility.
Balanced breakout risks emerge as volatility tightens in near term
In the next two to three trading days, AEM is forecast to trade within a C$270.22–C$284.5 volatility band relative to current levels. The likelihood of an upward or downward breakout from this range is balanced at 50% each, so neither direction is favored. The baseline expectation is for the price to remain in a sideways corridor; a move above C$284.5 could set up a bullish extension, while a break below C$270.22 would point to additional downside risk.
Earlier, analysts noted that Agnico Eagle Mines was positioned for continued growth following strong operational results and portfolio optimization efforts. The latest outperformance in quarterly earnings, coupled with the company's strategic focus on selective investments, reaffirms the baseline scenario that AEM is likely to remain range-bound in the coming sessions, with attention warranted on potential breakouts from its current volatility band.










-
 Afghanistan
-
 Albania
-
 Algeria
-
 Angola
-
 Argentina
-
 Armenia
-
 Australia
-
 Austria
-
 Azerbaijan
-
 Bahamas
-
 Bahrain
-
 Bangladesh
-
 Belarus
-
 Belgium
-
 Bolivia
-
 Botswana
-
 Brazil
-
 Brunei
-
 Bulgaria
-
 Cambodia
-
 Cameroon
-
 Canada
-
 Chile
-
 China
-
 Colombia
-
 Congo
-
 Costa Rica
-
 Cote d'Ivoire
-
 Croatia
-
 Cuba
-
 Cyprus
-
 Czechia
-
 DR Congo
-
 Denmark
-
 Dominican Republic
-
 Ecuador
-
 Egypt
-
 El Salvador
-
 Estonia
-
 Eswatini
-
 Ethiopia
-
 Finland
-
 France
-
 Georgia
-
 Germany
-
 Ghana
-
 Greece
-
 Haiti
-
 Hong Kong
-
 Hungary
-
 India
-
 Indonesia
-
 Iran, Islamic republic
-
 Iraq
-
 Ireland
-
 Israel
-
 Italy
-
 Jamaica
-
 Japan
-
 Jordan
-
 Kazakhstan
-
 Kenya
-
 Korea
-
 Kuwait
-
 Kyrgyzstan
-
 Laos
-
 Latvia
-
 Lebanon
-
 Lesotho
-
 Libya
-
 Lithuania
-
 Luxembourg
-
 Madagascar
-
 Malaysia
-
 Malta
-
 Mauritius
-
 Mexico
-
 Moldova
-
 Mongolia
-
 Montenegro
-
 Morocco
-
 Mozambique
-
 Myanmar
-
 Namibia
-
 Nepal
-
 Netherlands
-
 New Zealand
-
 Nigeria
-
 North Macedonia
-
 Norway
-
 Oman
-
 Pakistan
-
 Palestine
-
 Panama
-
 Papua New Guinea
-
 Paraguay
-
 Peru
-
 Philippines
-
 Poland
-
 Portugal
-
 Puerto Rico
-
 Qatar
-
 Reunion
-
 Romania
-
 Rwanda
-
 Saudi Arabia
-
 Serbia
-
 Singapore
-
 Slovakia
-
 Slovenia
-
 Somalia
-
 South Africa
-
 Spain
-
 Sri Lanka
-
 Sweden
-
 Switzerland
-
 Syria
-
 Taiwan
-
 Tajikistan
-
 Tanzania
-
 Thailand
-
 Trinidad and Tobago
-
 Tunisia
-
 Turkey
-
 UAE
-
 Uganda
-
 Ukraine
-
 United Kingdom
-
United States
-
 Uruguay
-
 Uzbekistan
-
 Venezuela
-
 Vietnam
-
 Yemen
-
 Zambia
-
 Zimbabwe
- Forex
- Crypto












