

Can AEM stock hold above C$250.18 support amid elevated volatility and overbought conditions?

Agnico Eagle Mines (AEM) stock is trading at C$264.1, showing a slight move lower on the day. Shares remain above key moving averages, indicating continued constructive positioning in the broader trend.
 270.75
270.97
Highlights
- Agnico Eagle Mines posted third quarter 2026 net income of $1,352.87 million and basic EPS of $2.67 from continuing operations.
- The company declared a $0.45 quarterly dividend and affirmed updated 2026 gold production guidance of 3.3 million to 3.5 million ounces.
- Shares of Agnico Eagle Mines show strong bullish momentum with overbought technical signals and project a short-term trading range of C$249.24 to C$278.96.
Robust earnings and dividend lift sentiment as 2026 targets reaffirmed
Agnico Eagle Mines reported third quarter 2026 net income of US$1,352.87 million and basic EPS of US$2.67 from continuing operations, according to Simplywall. This strong earnings result highlights operational efficiency and supports the company’s valuation profile. Agnico Eagle Mines also declared a US$0.45 quarterly dividend, with specified record and payment dates, reflecting a continued commitment to returning capital to shareholders. The company further updated its 2026 gold production guidance to a range of 3.3 million to 3.5 million ounces and confirmed on October 28, 2026 that it remains on track to meet its annual production and cost goals.
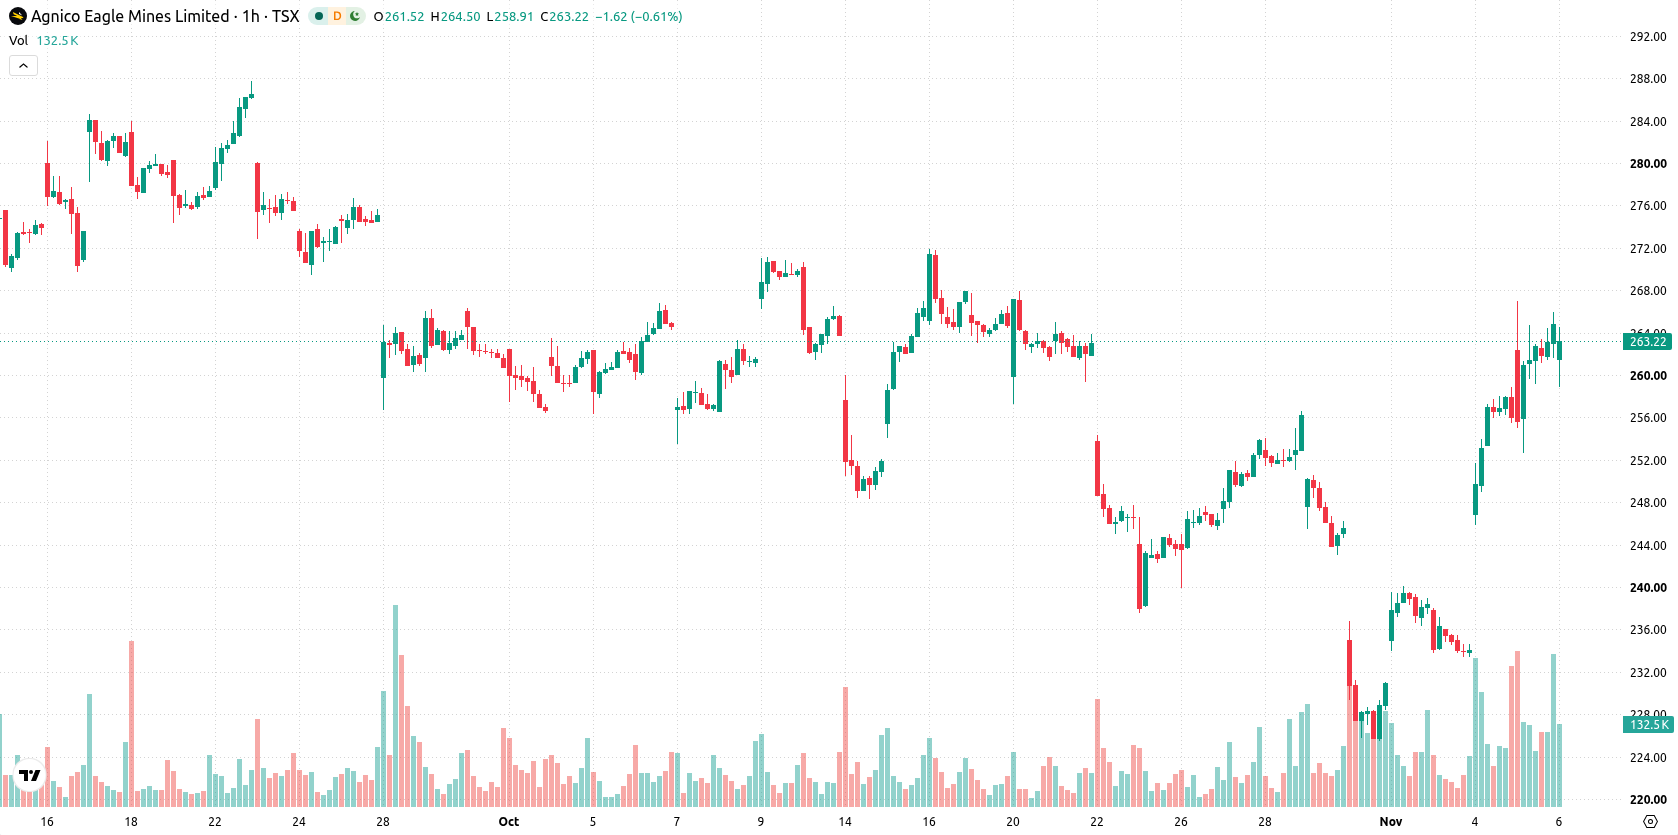
Bullish trend intact as overbought signals warn of pullback risk
AEM is trading above the MA-20 and MA-50 on the hourly chart and above the MA-200 on the daily timeframe, confirming a bullish price structure. The Ichimoku Kijun on the daily chart stands at C$250.18, providing immediate support for the current move. Among momentum indicators, both MACD and ADX are positive, while RSI and Stoch RSI are in overbought zones, signaling potential for a near-term pullback; CCI is neutral. Bull/Bear Power shows strong buyer dominance intraday, the Awesome Oscillator remains neutral, and intraday volatility is elevated.
High breakout probability as rangebound scenario dominates near term
Over the short term, AEM is expected to trade within a C$249.24 to C$278.96 volatility band, reflecting typical movement around current levels. The probability of an upward move breaking above resistance is considered very high, while the likelihood of a downward break below support is very low. If price remains within the projected range, a consolidation scenario is favored. Should AEM push above the upper boundary, further gains may unfold; a sharp drop below support would suggest a deeper retracement toward recent lows.
Previously it was reported that Agnico Eagle Mines exhibited short-term momentum while technical indicators suggested the potential for a near-term pullback. The current analysis builds on this outlook by incorporating updated financial results and revised production guidance, underscoring C$249.24 and C$278.96 as the volatility band traders should monitor for potential breakout or consolidation scenarios.










-
 Afghanistan
-
 Albania
-
 Algeria
-
 Angola
-
 Argentina
-
 Armenia
-
 Australia
-
 Austria
-
 Azerbaijan
-
 Bahamas
-
 Bahrain
-
 Bangladesh
-
 Belarus
-
 Belgium
-
 Bolivia
-
 Botswana
-
 Brazil
-
 Brunei
-
 Bulgaria
-
 Cambodia
-
 Cameroon
-
 Canada
-
 Chile
-
 China
-
 Colombia
-
 Congo
-
 Costa Rica
-
 Cote d'Ivoire
-
 Croatia
-
 Cuba
-
 Cyprus
-
 Czechia
-
 DR Congo
-
 Denmark
-
 Dominican Republic
-
 Ecuador
-
 Egypt
-
 El Salvador
-
 Estonia
-
 Eswatini
-
 Ethiopia
-
 Finland
-
 France
-
 Georgia
-
 Germany
-
 Ghana
-
 Greece
-
 Haiti
-
 Hong Kong
-
 Hungary
-
 India
-
 Indonesia
-
 Iran, Islamic republic
-
 Iraq
-
 Ireland
-
 Israel
-
 Italy
-
 Jamaica
-
 Japan
-
 Jordan
-
 Kazakhstan
-
 Kenya
-
 Korea
-
 Kuwait
-
 Kyrgyzstan
-
 Laos
-
 Latvia
-
 Lebanon
-
 Lesotho
-
 Libya
-
 Lithuania
-
 Luxembourg
-
 Madagascar
-
 Malaysia
-
 Malta
-
 Mauritius
-
 Mexico
-
 Moldova
-
 Mongolia
-
 Montenegro
-
 Morocco
-
 Mozambique
-
 Myanmar
-
 Namibia
-
 Nepal
-
 Netherlands
-
 New Zealand
-
 Nigeria
-
 North Macedonia
-
 Norway
-
 Oman
-
 Pakistan
-
 Palestine
-
 Panama
-
 Papua New Guinea
-
 Paraguay
-
 Peru
-
 Philippines
-
 Poland
-
 Portugal
-
 Puerto Rico
-
 Qatar
-
 Reunion
-
 Romania
-
 Rwanda
-
 Saudi Arabia
-
 Serbia
-
 Singapore
-
 Slovakia
-
 Slovenia
-
 Somalia
-
 South Africa
-
 Spain
-
 Sri Lanka
-
 Sweden
-
 Switzerland
-
 Syria
-
 Taiwan
-
 Tajikistan
-
 Tanzania
-
 Thailand
-
 Trinidad and Tobago
-
 Tunisia
-
 Turkey
-
 UAE
-
 Uganda
-
 Ukraine
-
 United Kingdom
-
United States
-
 Uruguay
-
 Uzbekistan
-
 Venezuela
-
 Vietnam
-
 Yemen
-
 Zambia
-
 Zimbabwe
- Forex
- Crypto












