


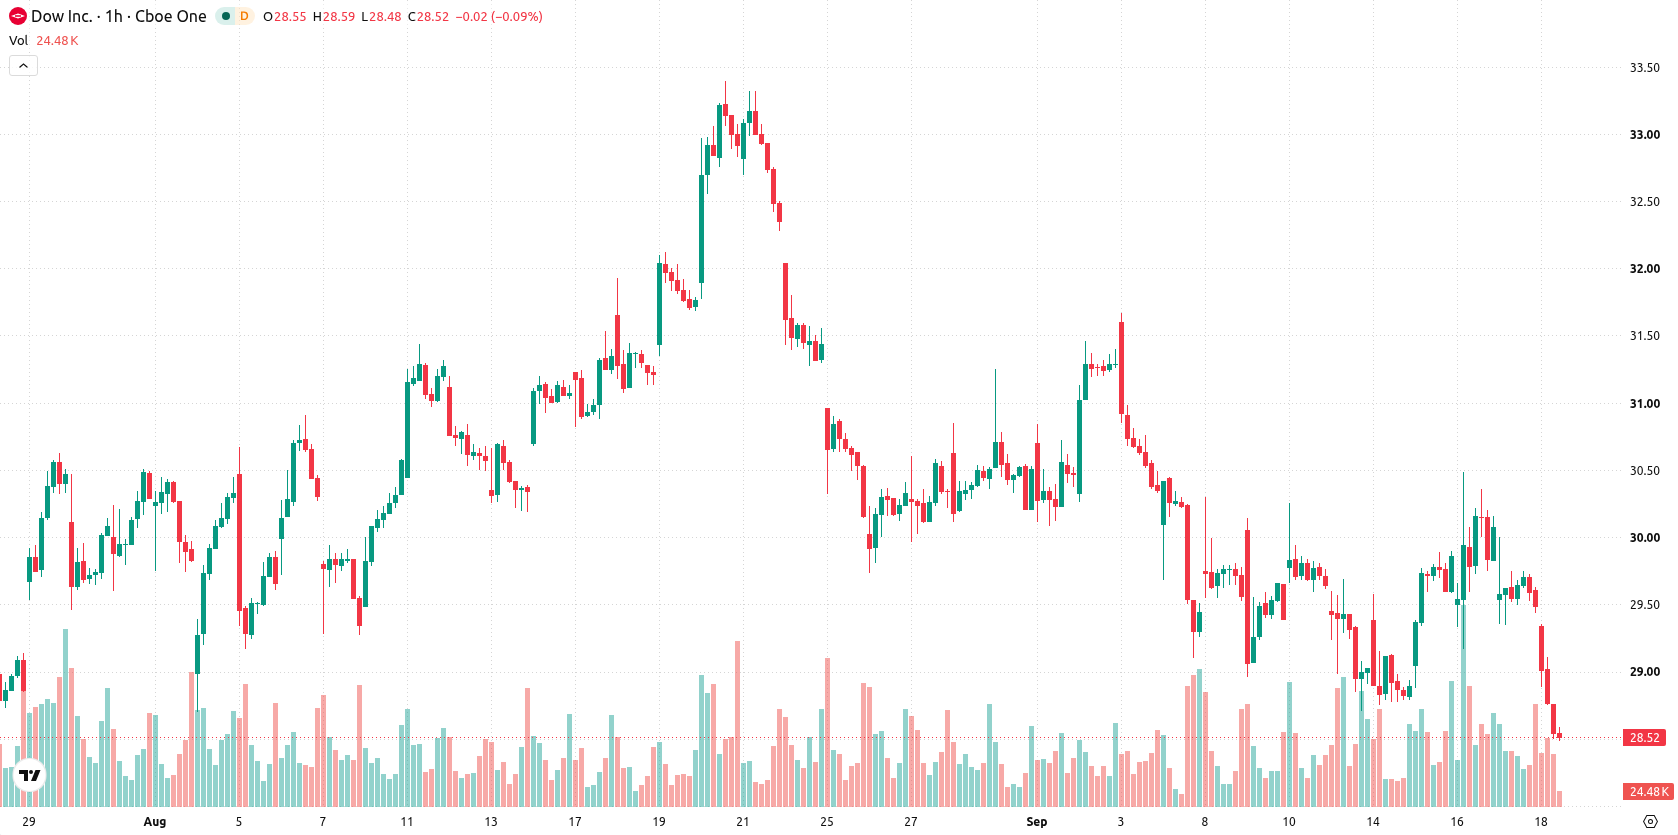
Dow (DOW) stock is trading at $28.56, down 3.09% on the day and near its session lows. The price remains below its key moving averages, reflecting continued downside momentum.
 34.85
34.85
Highlights
- DOW/USD is trading below key moving averages, confirming downward pressure across short and long timeframes.
- Oscillator readings mostly indicate oversold conditions and seller control, despite a single strong buy momentum signal.
- Over the next 2 to 3 days, price is likely to remain between 27.81 and 29.31, with a high risk of further decline if support fails.
Mixed momentum and resistance as bearish signals outweigh
DOW is trading below the MA-20 at $29.75, MA-50 at $29.5, and the longer-term MA-200 at $31.76. The Ichimoku Kijun sits at $29.63, marking immediate resistance. Momentum indicators are mixed: MACD gives a strong buy signal, while ADX is neutral. RSI stands at 46.23 (Sell), with both Stochastic RSI and CCI signaling oversold conditions, and Bull/Bear Power indicating seller dominance. The price is close to the day’s low with only a minor gap of 0.17, and the divergence between weak oscillators and a strong MACD suggests caution.
Downside risks dominate as volatility band narrows outlook
Over the next 2–3 days, DOW is expected to move within a $27.81–$29.31 volatility band. The probability of an upward move is very low, while the likelihood of further downside remains high. The baseline scenario is continued sideways trading. A breakout above $29.63 would indicate a bullish reversal, whereas a breach below $27.81 could extend the decline.
Earlier, analysts noted that Dow Inc. continued to experience dominant bearish momentum amid persistent downside pressure. The current analysis largely confirms this outlook, with traders advised to monitor the $29.63 resistance and $27.81 support as key levels for any potential breakout or extended decline.






Latest Dow Inc. News





-
 Afghanistan
-
 Albania
-
 Algeria
-
 Angola
-
 Argentina
-
 Armenia
-
 Australia
-
 Austria
-
 Azerbaijan
-
 Bahamas
-
 Bahrain
-
 Bangladesh
-
 Belarus
-
 Belgium
-
 Bolivia
-
 Botswana
-
 Brazil
-
 Brunei
-
 Bulgaria
-
 Cambodia
-
 Cameroon
-
 Canada
-
 Chile
-
 China
-
 Colombia
-
 Congo
-
 Costa Rica
-
 Cote d'Ivoire
-
 Croatia
-
 Cuba
-
 Cyprus
-
 Czechia
-
 DR Congo
-
 Denmark
-
 Dominican Republic
-
 Ecuador
-
 Egypt
-
 El Salvador
-
 Estonia
-
 Eswatini
-
 Ethiopia
-
 Finland
-
 France
-
 Georgia
-
 Germany
-
 Ghana
-
 Greece
-
 Haiti
-
 Hong Kong
-
 Hungary
-
 India
-
 Indonesia
-
 Iran, Islamic republic
-
 Iraq
-
 Ireland
-
 Israel
-
 Italy
-
 Jamaica
-
 Japan
-
 Jordan
-
 Kazakhstan
-
 Kenya
-
 Korea
-
 Kuwait
-
 Kyrgyzstan
-
 Laos
-
 Latvia
-
 Lebanon
-
 Lesotho
-
 Libya
-
 Lithuania
-
 Luxembourg
-
 Madagascar
-
 Malaysia
-
 Malta
-
 Mauritius
-
 Mexico
-
 Moldova
-
 Mongolia
-
 Montenegro
-
 Morocco
-
 Mozambique
-
 Myanmar
-
 Namibia
-
 Nepal
-
 Netherlands
-
 New Zealand
-
 Nigeria
-
 North Macedonia
-
 Norway
-
 Oman
-
 Pakistan
-
 Palestine
-
 Panama
-
 Papua New Guinea
-
 Paraguay
-
 Peru
-
 Philippines
-
 Poland
-
 Portugal
-
 Puerto Rico
-
 Qatar
-
 Reunion
-
 Romania
-
 Rwanda
-
 Saudi Arabia
-
 Serbia
-
 Singapore
-
 Slovakia
-
 Slovenia
-
 Somalia
-
 South Africa
-
 Spain
-
 Sri Lanka
-
 Sweden
-
 Switzerland
-
 Syria
-
 Taiwan
-
 Tajikistan
-
 Tanzania
-
 Thailand
-
 Trinidad and Tobago
-
 Tunisia
-
 Turkey
-
 UAE
-
 Uganda
-
 Ukraine
-
 United Kingdom
-
United States
-
 Uruguay
-
 Uzbekistan
-
 Venezuela
-
 Vietnam
-
 Yemen
-
 Zambia
-
 Zimbabwe
- Forex
- Crypto












