

Oversold RSI signal: Can Qualcomm stock sustain rebound?

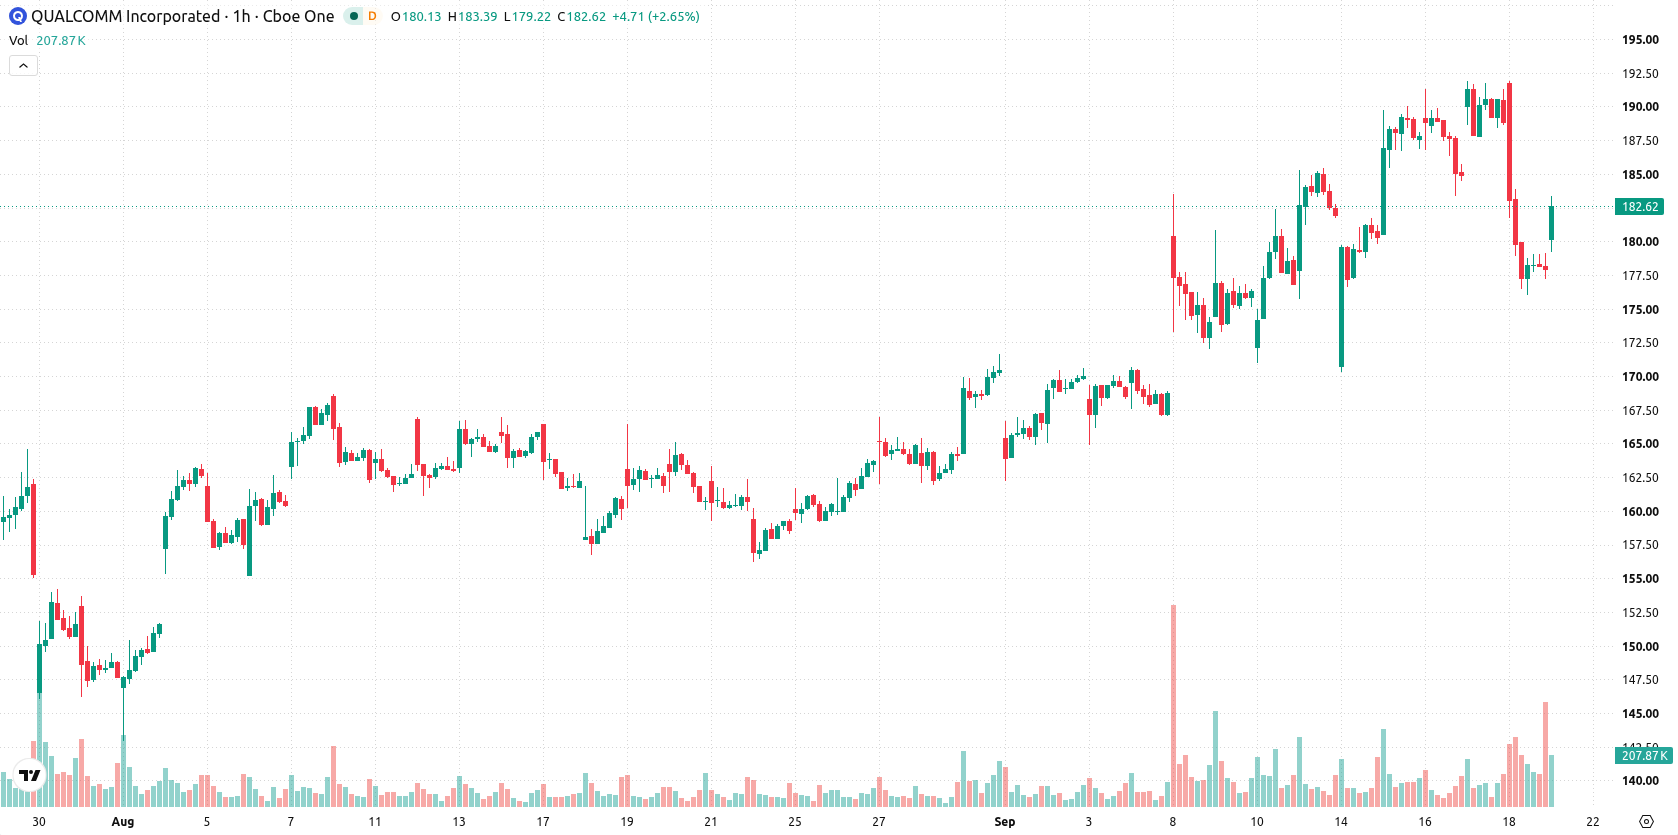
Qualcomm (QCOM) stock is trading at $183.3, up 3.04% on the day. The price is currently positioned below its key moving averages over short and medium timeframes, while remaining above the long-term average.
 169.40
185.54
Highlights
- Shares of QCOM trade below key short- and medium-term moving averages, indicating ongoing downward pressure in the near term.
- Momentum signals are bearish with negative MACD and AO readings and oversold oscillators, while ADX does not confirm a strong trend.
- QCOM is expected to fluctuate within a $176.27 to $190.33 range over the next 2 to 3 days, with a 67% probability of moving upward if resistance is cleared.
Mixed technical signals as oversold conditions contrast prevailing seller strength
QCOM is trading below the MA-20 at $185.24 and the MA-50 at $183.45 on the H1 chart, but remains above the MA-200 at $168.55 on the daily timeframe. The Ichimoku Kijun on the daily chart stands at $184.05 and currently acts as immediate resistance. Momentum indicators are negative, as both MACD and the Awesome Oscillator point to ongoing selling pressure. ADX is neutral, while RSI is at 37.27, Stochastic RSI is in oversold territory, and CCI is also oversold. Intraday activity is marked by a strong 5.02 gap up to $183.3 and elevated volatility, yet oversold oscillators highlight a divergence compared to the prevailing seller dominance seen on Bull/Bear Power.
Directional breakout risk as projected range tightens
In the short term, QCOM is likely to trade within the $176.27 to $190.33 range over the next two to three sessions. The probability of an upward move is estimated at 67%, while the likelihood of a downward scenario is 33%. Should the price break above immediate resistance, a move toward the upper end of the projected range is feasible; conversely, a drop below support would put the lower boundary of the range at increased risk.
Earlier, analysts noted that Qualcomm’s longer-term bullish technical structure was intact, supported by ongoing diversification and a major AI chip partnership, despite episodes of selling pressure. The current set-up reflects a more cautious short-term outlook, with oversold indicators suggesting traders should closely watch for a potential reversal if immediate resistance levels are breached.






Latest Qualcomm News




-
 Afghanistan
-
 Albania
-
 Algeria
-
 Angola
-
 Argentina
-
 Armenia
-
 Australia
-
 Austria
-
 Azerbaijan
-
 Bahamas
-
 Bahrain
-
 Bangladesh
-
 Belarus
-
 Belgium
-
 Bolivia
-
 Botswana
-
 Brazil
-
 Brunei
-
 Bulgaria
-
 Cambodia
-
 Cameroon
-
 Canada
-
 Chile
-
 China
-
 Colombia
-
 Congo
-
 Costa Rica
-
 Cote d'Ivoire
-
 Croatia
-
 Cuba
-
 Cyprus
-
 Czechia
-
 DR Congo
-
 Denmark
-
 Dominican Republic
-
 Ecuador
-
 Egypt
-
 El Salvador
-
 Estonia
-
 Eswatini
-
 Ethiopia
-
 Finland
-
 France
-
 Georgia
-
 Germany
-
 Ghana
-
 Greece
-
 Haiti
-
 Hong Kong
-
 Hungary
-
 India
-
 Indonesia
-
 Iran, Islamic republic
-
 Iraq
-
 Ireland
-
 Israel
-
 Italy
-
 Jamaica
-
 Japan
-
 Jordan
-
 Kazakhstan
-
 Kenya
-
 Korea
-
 Kuwait
-
 Kyrgyzstan
-
 Laos
-
 Latvia
-
 Lebanon
-
 Lesotho
-
 Libya
-
 Lithuania
-
 Luxembourg
-
 Madagascar
-
 Malaysia
-
 Malta
-
 Mauritius
-
 Mexico
-
 Moldova
-
 Mongolia
-
 Montenegro
-
 Morocco
-
 Mozambique
-
 Myanmar
-
 Namibia
-
 Nepal
-
 Netherlands
-
 New Zealand
-
 Nigeria
-
 North Macedonia
-
 Norway
-
 Oman
-
 Pakistan
-
 Palestine
-
 Panama
-
 Papua New Guinea
-
 Paraguay
-
 Peru
-
 Philippines
-
 Poland
-
 Portugal
-
 Puerto Rico
-
 Qatar
-
 Reunion
-
 Romania
-
 Rwanda
-
 Saudi Arabia
-
 Serbia
-
 Singapore
-
 Slovakia
-
 Slovenia
-
 Somalia
-
 South Africa
-
 Spain
-
 Sri Lanka
-
 Sweden
-
 Switzerland
-
 Syria
-
 Taiwan
-
 Tajikistan
-
 Tanzania
-
 Thailand
-
 Trinidad and Tobago
-
 Tunisia
-
 Turkey
-
 UAE
-
 Uganda
-
 Ukraine
-
 United Kingdom
-
United States
-
 Uruguay
-
 Uzbekistan
-
 Venezuela
-
 Vietnam
-
 Yemen
-
 Zambia
-
 Zimbabwe
- Forex
- Crypto












