

Rivian stock price prediction: Rebound setup in focus

Rivian Automotive, Inc. (RIVN) stock is trading at $15.43 after rising 3.01% over the last session. The price is currently positioned between key moving averages, reflecting short-term momentum amid moderate volatility.
 13.89
14.82
13.89
14.82
Highlights
- Shares of Rivian saw trading volume surge 25% above average on September 18, 2026, indicating increased market activity.
- Elevated liquidity signals intensified investor focus, with the stock showing increased sensitivity to developing narratives.
- Technicals signal short-term strength but medium- and long-term bearish pressure, with RIVN expected to move within the $14.87 to $15.99 range over the next 2 to 3 sessions.
Trading volume surge as investor interest lifts market activity
According to Defenseworld, shares of Rivian Automotive, Inc. saw trading volume surge 25% above average on September 18, 2026, highlighting a notable uptick in market participation. Increased liquidity and activity can amplify price movements, reflecting intensified investor focus on Rivian. This elevated trading interest underscores the stock's responsiveness to developing corporate or broader market narratives.
Sell bias persists as key moving averages and oscillators diverge
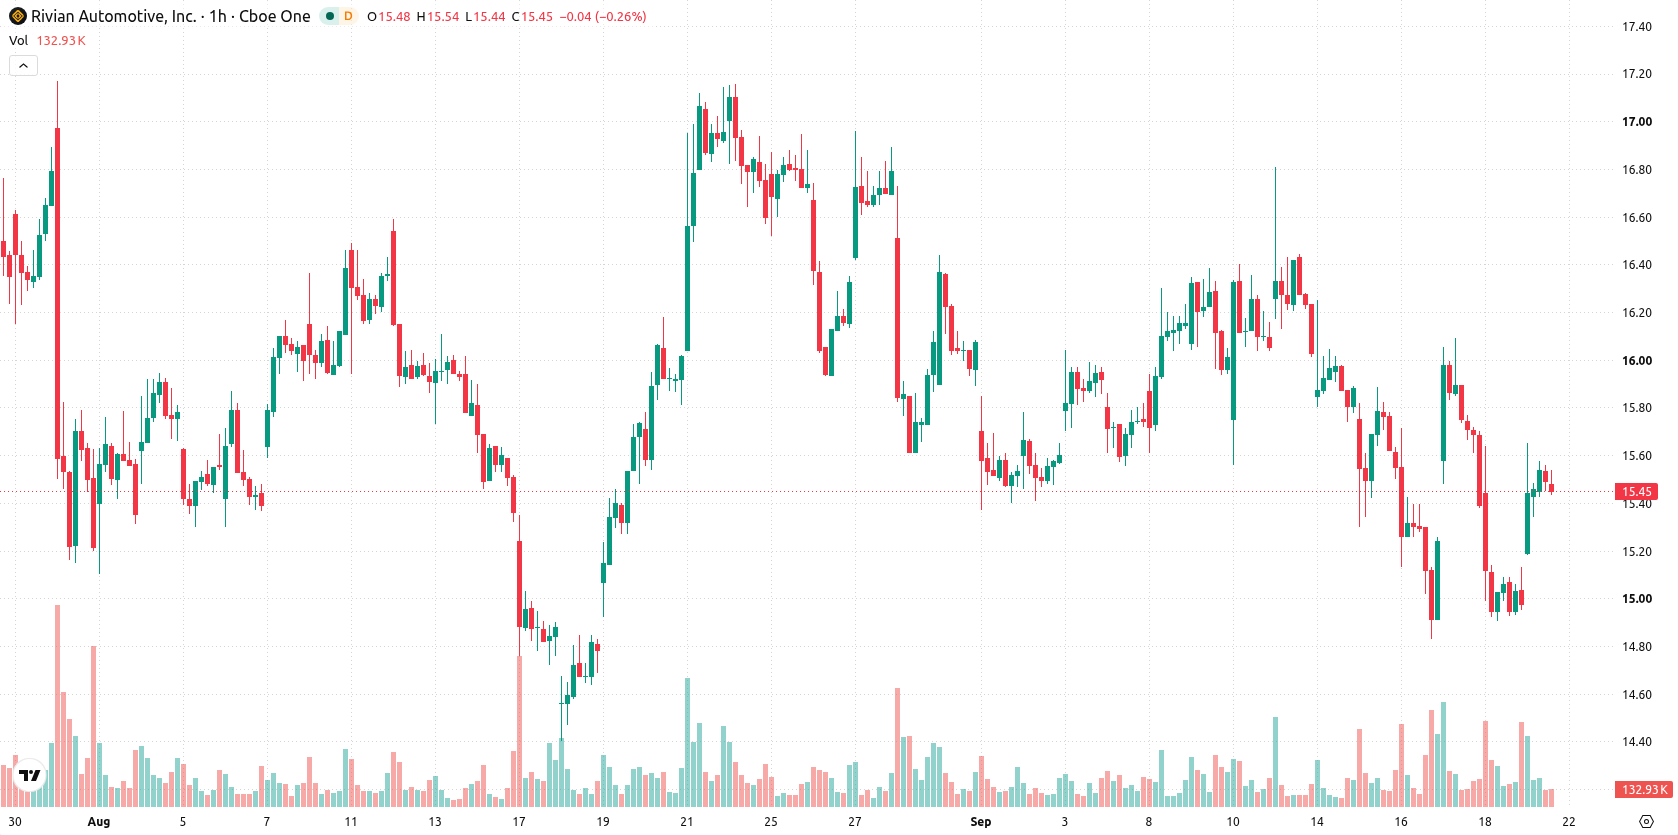
On the hourly chart, RIVN trades above the MA-20 at $15.32 but remains below the MA-50 at $15.69 and the daily MA-200 at $16.3. The Ichimoku Kijun level at $15.46 currently serves as immediate resistance. MACD and ADX both indicate a prevailing sell bias, with negative momentum reinforced by a weak RSI at 38.08. CCI also points to selling pressure, while the Stoch RSI signals oversold conditions, suggesting the possibility of short-term buyer exhaustion. Bull/Bear Power continues to favor sellers intraday, though the Awesome Oscillator appears neutral and does not support a directional trend. Momentum and oscillator signals remain mixed overall, reflecting lingering bearish sentiment set against some indications of intraday accumulation.
Consolidation likely as bearish technicals outweigh upside breakout risk
In the short term, RIVN is expected to consolidate within the $14.87–$15.99 volatility band based on recent price action. The baseline scenario calls for continued sideways movement within this corridor over the next two to three sessions. A bullish breakout above $15.46 (Ichimoku Kijun) and the MA-50 could enable further gains, while a decisive move below $14.87 would likely intensify downside momentum. The probability of an upward move stands at 38%, with a higher likelihood assigned to a downward scenario given the current technical backdrop.
Earlier, analysts noted that Rivian faced a mixed technical outlook with near-term sideways movement expected as traders watched key support and resistance levels. The latest surge in trading activity and ongoing technical divergence add a new layer of complexity, making the $15.46 resistance a critical level to monitor for any potential shift in momentum.





Latest Rivian Automotive News





-
 Afghanistan
-
 Albania
-
 Algeria
-
 Angola
-
 Argentina
-
 Armenia
-
 Australia
-
 Austria
-
 Azerbaijan
-
 Bahamas
-
 Bahrain
-
 Bangladesh
-
 Belarus
-
 Belgium
-
 Bolivia
-
 Botswana
-
 Brazil
-
 Brunei
-
 Bulgaria
-
 Cambodia
-
 Cameroon
-
 Canada
-
 Chile
Chile
-
 China
China
-
 Colombia
-
 Congo
Congo
-
 Costa Rica
-
 Cote d'Ivoire
-
 Croatia
-
 Cuba
Cuba
-
 Cyprus
-
 Czechia
-
 DR Congo
-
 Denmark
-
 Dominican Republic
-
 Ecuador
-
 Egypt
Egypt
-
 El Salvador
-
 Estonia
-
 Eswatini
-
 Ethiopia
-
 Finland
-
 France
-
 Georgia
-
 Germany
-
 Ghana
Ghana
-
 Greece
-
 Haiti
Haiti
-
 Hong Kong
-
 Hungary
-
 India
India
-
 Indonesia
-
 Iran, Islamic republic
-
 Iraq
Iraq
-
 Ireland
-
 Israel
-
 Italy
Italy
-
 Jamaica
-
 Japan
Japan
-
 Jordan
-
 Kazakhstan
-
 Kenya
Kenya
-
 Korea
Korea
-
 Kuwait
-
 Kyrgyzstan
-
 Laos
Laos
-
 Latvia
-
 Lebanon
-
 Lesotho
-
 Libya
Libya
-
 Lithuania
-
 Luxembourg
-
 Madagascar
-
 Malaysia
-
 Malta
Malta
-
 Mauritius
-
 Mexico
-
 Moldova
-
 Mongolia
-
 Montenegro
-
 Morocco
-
 Mozambique
-
 Myanmar
-
 Namibia
-
 Nepal
Nepal
-
 Netherlands
-
 New Zealand
-
 Nigeria
-
 North Macedonia
-
 Norway
-
 Oman
Oman
-
 Pakistan
-
 Palestine
-
 Panama
-
 Papua New Guinea
-
 Paraguay
-
 Peru
Peru
-
 Philippines
-
 Poland
-
 Portugal
-
 Puerto Rico
-
 Qatar
Qatar
-
 Reunion
-
 Romania
-
 Rwanda
-
 Saudi Arabia
-
 Serbia
-
 Singapore
-
 Slovakia
-
 Slovenia
-
 Somalia
-
 South Africa
-
 Spain
Spain
-
 Sri Lanka
-
 Sweden
-
 Switzerland
-
 Syria
Syria
-
 Taiwan
-
 Tajikistan
-
 Tanzania
-
 Thailand
-
 Trinidad and Tobago
-
 Tunisia
-
 Turkey
-
 UAE
UAE
-
 Uganda
-
 Ukraine
-
 United Kingdom
-
United States
-
 Uruguay
-
 Uzbekistan
-
 Venezuela
-
 Vietnam
-
 Yemen
Yemen
-
 Zambia
-
 Zimbabwe
- Forex
- Crypto












