

Why is Charles Schwab stock down today? Downside momentum and support levels to watch

Charles Schwab (SCHW) stock is trading at $102.9, down 3.73% for the session. The price sits below its key moving averages and remains near the day's low in a moderately volatile trading environment.
 92.91
93.91
Highlights
- Charles Schwab stock has outperformed the market by 2.6% annualized over 15 years, with a 15.97% average annual return.
- With a market capitalization of $183.11 billion, Schwab remains a large-cap holding relevant to institutional investors.
- Shares of Charles Schwab trade below short- and medium-term moving averages, with a projected range of $101.18 to $107.8 and a high probability of further downside.
Long-term outperformance shapes expectations but sells persist amid volatility
Charles Schwab has recorded a 2.6% annualized outperformance versus the market over the past 15 years, generating a 15.97% average annual return, according to Benzinga. This sustained track record highlights the company's historical ability to deliver long-term capital appreciation, which shapes fundamental investor expectations. Charles Schwab's current market capitalization of $183.11 billion, as reported by Benzinga, underscores its status as a large-cap stock and affirms its continued relevance among institutional portfolios, though price action has remained under broader selling pressure.
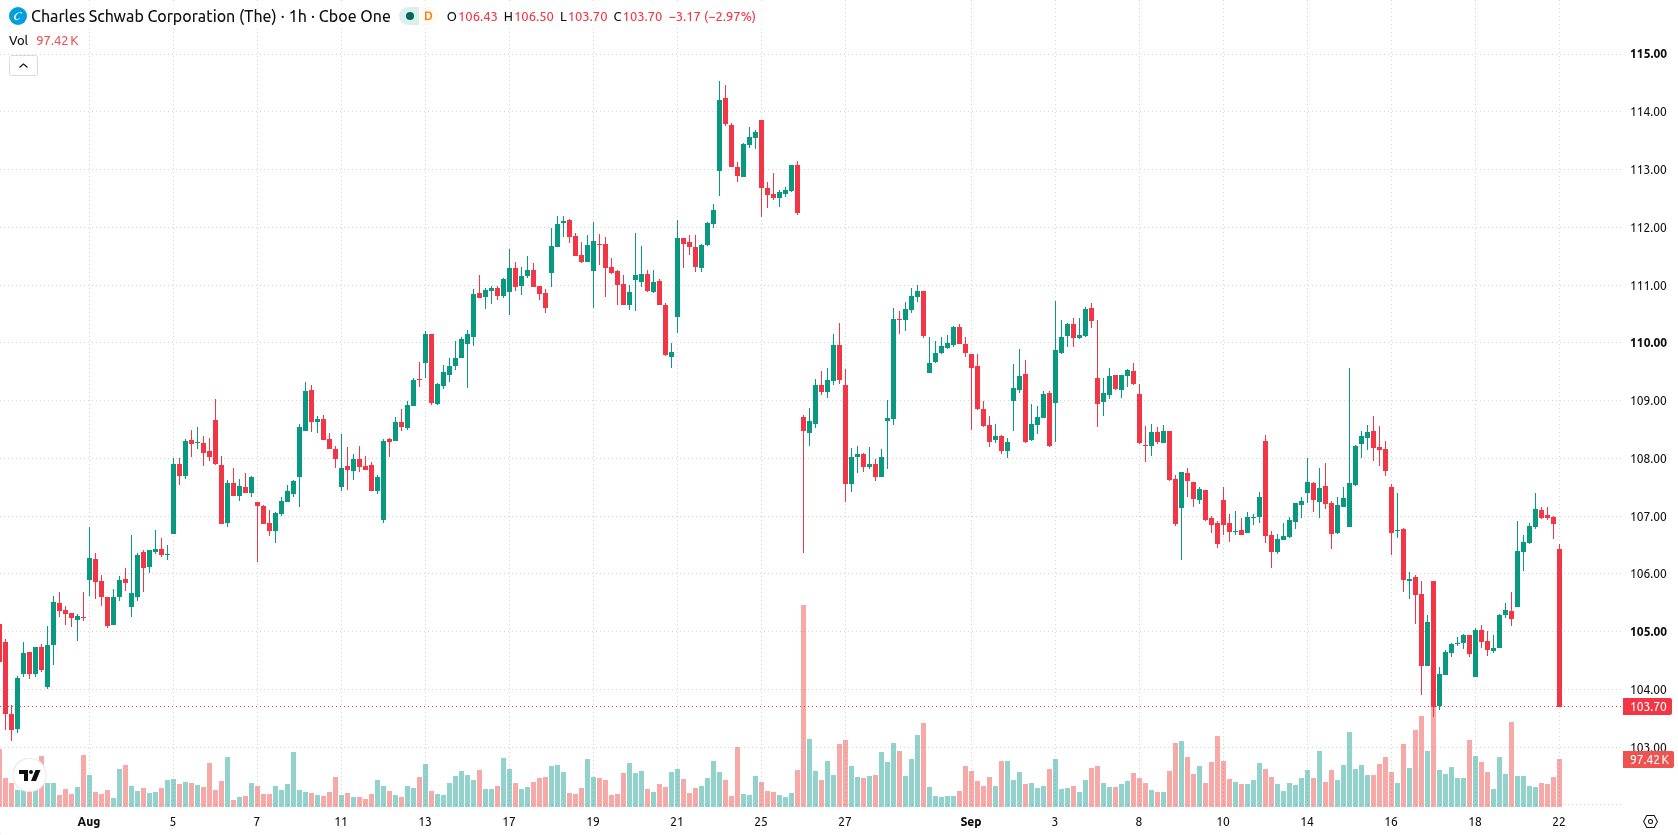
Bearish oscillators reinforce downside risk as resistance levels hold
SCHW is trading below the MA-20 at $105.52 and MA-50 at $106.28, with the MA-200 providing support at $98.17. The Ichimoku Kijun currently sits at $105.47 and acts as an immediate resistance. The MACD displays a Buy signal, but the ADX suggests weak trend strength and a Sell. RSI is at 35.1 and CCI is also signaling Sell, both pointing toward a bearish bias. Stoch RSI is in the Oversold region, Bull/Bear Power indicates buyers dominate on an intraday basis, and the Awesome Oscillator remains Neutral. The technical picture is mixed, with downside momentum aligned with several key oscillators despite isolated bullish signals.
Downside risk dominates short-term amid narrow trading range
Over the coming two to three sessions, SCHW is expected to trade within a volatility band between $101.18 and $107.8. The probability of an upward move is considered very low, while further downside is assessed as highly likely. The baseline scenario calls for sideways consolidation within this range. A break above the $105.47 resistance could trigger a push to the upper end of the projection, while sustained losses below $101.18 would open the door to additional decline.
Previously it was reported that Coinbase began offering eligible U.S. customers primary-market access to IPO shares through its platform, marking an expanded move into traditional stock markets. In contrast, current technical signals for Charles Schwab highlight downside momentum and weak trend strength, with traders advised to closely monitor the $101.18 support level for potential further declines.






Latest Charles Schwab News





-
 Afghanistan
-
 Albania
-
 Algeria
-
 Angola
-
 Argentina
-
 Armenia
-
 Australia
-
 Austria
-
 Azerbaijan
-
 Bahamas
-
 Bahrain
-
 Bangladesh
-
 Belarus
-
 Belgium
-
 Bolivia
-
 Botswana
-
 Brazil
-
 Brunei
-
 Bulgaria
-
 Cambodia
-
 Cameroon
-
 Canada
-
 Chile
-
 China
-
 Colombia
-
 Congo
-
 Costa Rica
-
 Cote d'Ivoire
-
 Croatia
-
 Cuba
-
 Cyprus
-
 Czechia
-
 DR Congo
-
 Denmark
-
 Dominican Republic
-
 Ecuador
-
 Egypt
-
 El Salvador
-
 Estonia
-
 Eswatini
-
 Ethiopia
-
 Finland
-
 France
-
 Georgia
-
 Germany
-
 Ghana
-
 Greece
-
 Haiti
-
 Hong Kong
-
 Hungary
-
 India
-
 Indonesia
-
 Iran, Islamic republic
-
 Iraq
-
 Ireland
-
 Israel
-
 Italy
-
 Jamaica
-
 Japan
-
 Jordan
-
 Kazakhstan
-
 Kenya
-
 Korea
-
 Kuwait
-
 Kyrgyzstan
-
 Laos
-
 Latvia
-
 Lebanon
-
 Lesotho
-
 Libya
-
 Lithuania
-
 Luxembourg
-
 Madagascar
-
 Malaysia
-
 Malta
-
 Mauritius
-
 Mexico
-
 Moldova
-
 Mongolia
-
 Montenegro
-
 Morocco
-
 Mozambique
-
 Myanmar
-
 Namibia
-
 Nepal
-
 Netherlands
-
 New Zealand
-
 Nigeria
-
 North Macedonia
-
 Norway
-
 Oman
-
 Pakistan
-
 Palestine
-
 Panama
-
 Papua New Guinea
-
 Paraguay
-
 Peru
-
 Philippines
-
 Poland
-
 Portugal
-
 Puerto Rico
-
 Qatar
-
 Reunion
-
 Romania
-
 Rwanda
-
 Saudi Arabia
-
 Serbia
-
 Singapore
-
 Slovakia
-
 Slovenia
-
 Somalia
-
 South Africa
-
 Spain
-
 Sri Lanka
-
 Sweden
-
 Switzerland
-
 Syria
-
 Taiwan
-
 Tajikistan
-
 Tanzania
-
 Thailand
-
 Trinidad and Tobago
-
 Tunisia
-
 Turkey
-
 UAE
-
 Uganda
-
 Ukraine
-
 United Kingdom
-
United States
-
 Uruguay
-
 Uzbekistan
-
 Venezuela
-
 Vietnam
-
 Yemen
-
 Zambia
-
 Zimbabwe
- Forex
- Crypto












