

What's behind Hims & Hers Health's latest 4.7% stock surge?

Hims & Hers Health Inc (HIMS) advanced 4.74% as ongoing bullish technical momentum and strong upside price action supported buying interest. The move is confirmed by the stock trading above all key moving averages, highlighting a robust trend despite some overbought signals limiting further upside.
 20.14
25.62
Highlights
- Hims & Hers Health stock trades above all major moving averages, indicating continued bullish structure across trend horizons.
- Momentum signals are mixed with intraday buyers dominating but several indicators showing overbought or neutral conditions.
- Baseline forecast keeps the stock moving sideways within $29.42 to $31.66 over the next five trading days.
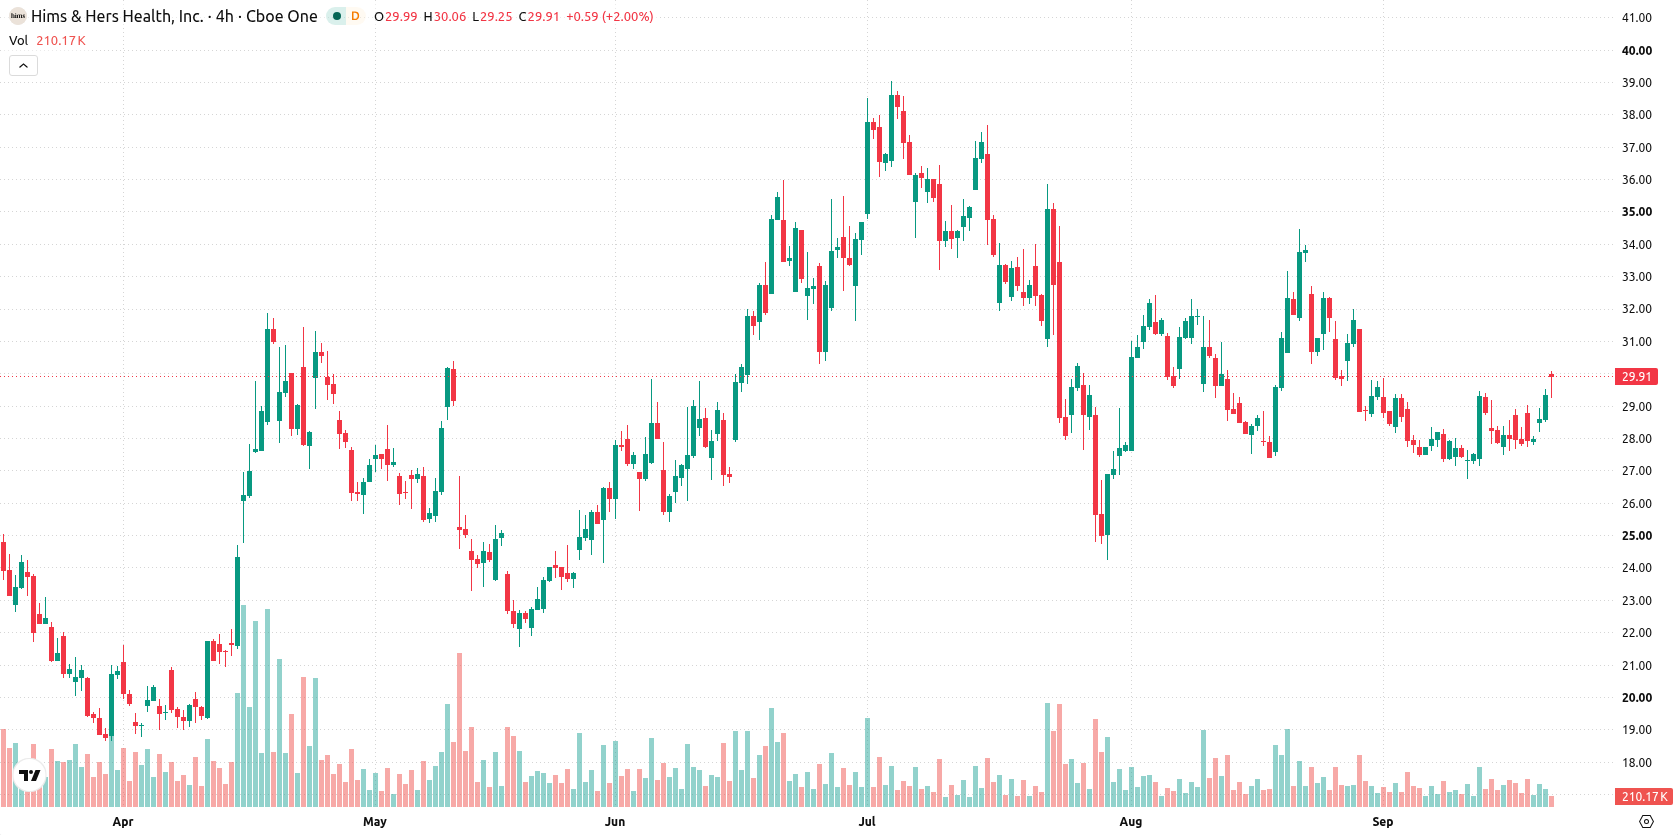
Mixed indicator signals as price nears resistance amid session highs
Hims & Hers Health trades above all key moving averages, with the price at $30.71 holding above the 20-day ($28.81), 50-day ($30.09), and 200-day ($27.95) levels. This signals ongoing bullish structure across short-, medium-, and long-term trends, confirmed by the bullish alignment of the MA-50 versus MA-200. The nearest support is at the Ichimoku Kijun level of $30.61, and the next ceiling is $31.66. Momentum signals are mixed: the MACD shows strong sell pressure, while the ADX is neutral, indicating a lack of dominant trend strength. The RSI at 51.43 gives a buy signal without indicating overbought conditions, but the Stochastic RSI and BBP both point to overbought territory. Intraday buyers dominate according to BBP, but the CCI and Awesome Oscillator remain neutral. The stock gained $1.39 or 4.74% after an initial downside gap at the open, with price now trading near the session high and intraday volatility at 4.58%. Overall, strong upside momentum is present into the session high, tempered by signs of overbought conditions and mixed signals from key indicators.
Earlier, analysts noted that Hims & Hers Health demonstrated sustained bullish momentum while cautioning that overbought technical signals and legal uncertainties could moderate further upside. The current analysis affirms this cautious stance but highlights that, with mixed momentum indicators, close attention should be paid to the $31.66 resistance as a potential inflection point for the stock’s next directional move.






Latest Hims & Hers News





-
 Afghanistan
-
 Albania
-
 Algeria
-
 Angola
-
 Argentina
-
 Armenia
-
 Australia
-
 Austria
-
 Azerbaijan
-
 Bahamas
-
 Bahrain
-
 Bangladesh
-
 Belarus
-
 Belgium
-
 Bolivia
-
 Botswana
-
 Brazil
-
 Brunei
-
 Bulgaria
-
 Cambodia
-
 Cameroon
-
 Canada
-
 Chile
-
 China
-
 Colombia
-
 Congo
-
 Costa Rica
-
 Cote d'Ivoire
-
 Croatia
-
 Cuba
-
 Cyprus
-
 Czechia
-
 DR Congo
-
 Denmark
-
 Dominican Republic
-
 Ecuador
-
 Egypt
-
 El Salvador
-
 Estonia
-
 Eswatini
-
 Ethiopia
-
 Finland
-
 France
-
 Georgia
-
 Germany
-
 Ghana
-
 Greece
-
 Haiti
-
 Hong Kong
-
 Hungary
-
 India
-
 Indonesia
-
 Iran, Islamic republic
-
 Iraq
-
 Ireland
-
 Israel
-
 Italy
-
 Jamaica
-
 Japan
-
 Jordan
-
 Kazakhstan
-
 Kenya
-
 Korea
-
 Kuwait
-
 Kyrgyzstan
-
 Laos
-
 Latvia
-
 Lebanon
-
 Lesotho
-
 Libya
-
 Lithuania
-
 Luxembourg
-
 Madagascar
-
 Malaysia
-
 Malta
-
 Mauritius
-
 Mexico
-
 Moldova
-
 Mongolia
-
 Montenegro
-
 Morocco
-
 Mozambique
-
 Myanmar
-
 Namibia
-
 Nepal
-
 Netherlands
-
 New Zealand
-
 Nigeria
-
 North Macedonia
-
 Norway
-
 Oman
-
 Pakistan
-
 Palestine
-
 Panama
-
 Papua New Guinea
-
 Paraguay
-
 Peru
-
 Philippines
-
 Poland
-
 Portugal
-
 Puerto Rico
-
 Qatar
-
 Reunion
-
 Romania
-
 Rwanda
-
 Saudi Arabia
-
 Serbia
-
 Singapore
-
 Slovakia
-
 Slovenia
-
 Somalia
-
 South Africa
-
 Spain
-
 Sri Lanka
-
 Sweden
-
 Switzerland
-
 Syria
-
 Taiwan
-
 Tajikistan
-
 Tanzania
-
 Thailand
-
 Trinidad and Tobago
-
 Tunisia
-
 Turkey
-
 UAE
-
 Uganda
-
 Ukraine
-
 United Kingdom
-
United States
-
 Uruguay
-
 Uzbekistan
-
 Venezuela
-
 Vietnam
-
 Yemen
-
 Zambia
-
 Zimbabwe
- Forex
- Crypto












