

AEM rises as Scout Discoveries stock investment expands exploration exposure

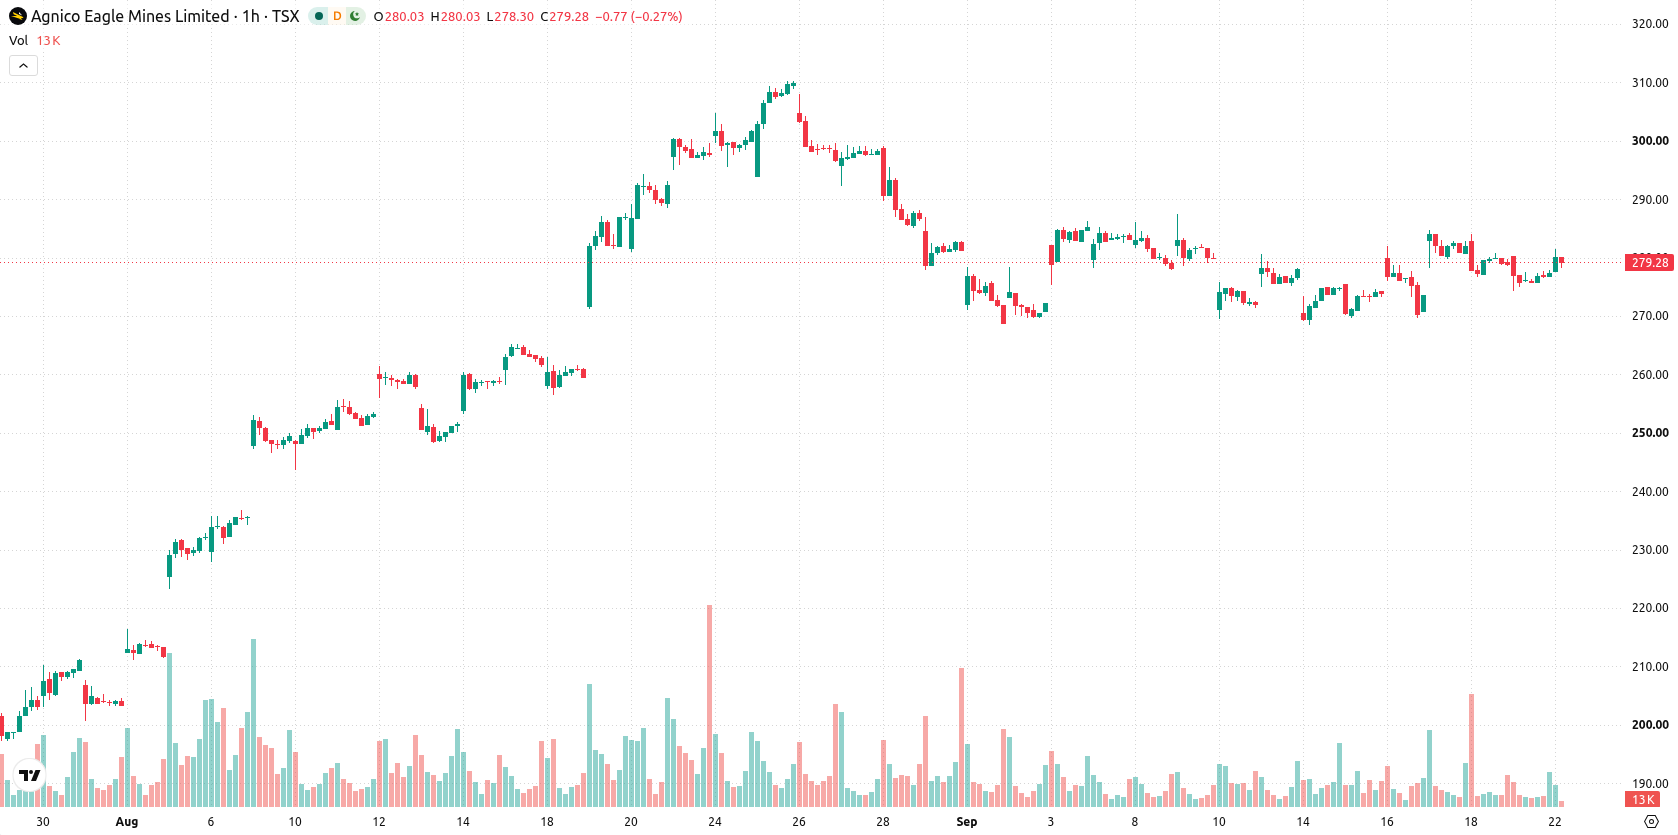
Agnico Eagle Mines (AEM) stock is trading at C$280.53, posting a gain of 1.14% on the day. The price sits comfortably above its key short- and intermediate-term moving averages in a session marked by low volatility and a close near today's high.
 270.75
Highlights
- Agnico Eagle Mines acquired approximately $14.77 million in Scout Discoveries stock, establishing a 14.9% ownership stake to expand its exploration portfolio.
- CEO Ammar Al‑Joundi confirmed Agnico Eagle will not participate in Barrick’s planned North American IPO, prioritizing internal strategic objectives.
- Agnico Eagle Mines stock closed at C$280.53, up 1.14%, with technical signals showing mixed momentum within an expected C$273.96 to C$287.1 range.
Growth strategy as Agnico increases stake and avoids IPO tie-up
Agnico Eagle Mines Ltd has expanded its exploration portfolio by acquiring approximately $14.77 million worth of Scout Discoveries stock in a private placement, taking a roughly 14.9% stake. This targeted investment increases Agnico's exposure to emerging resource opportunities, directly supporting a proactive growth and development strategy. Additionally, CEO Ammar Al‑Joundi stated, according to Tradingview, that the company will not participate in Barrick’s planned North American IPO, underscoring Agnico’s focus on its own strategic priorities and independent capital allocation.
Mixed technical signals as price outpaces key moving averages
On the technical front, AEM/CAD is currently trading above the MA-20 and MA-50 on the hourly chart, as well as holding well above the MA-200 on the daily timeframe. Key support is noted at the Ichimoku Kijun level of C$277.16. Momentum indicators present a mixed picture: both MACD and ADX remain neutral, while RSI and CCI are aligned with Sell signals—CCI notably suggesting a bearish intraday bias. Stochastic RSI and Awesome Oscillator are neutral, and Bull/Bear Power indicates an oversold condition, reflecting intraday seller dominance.
Sideways trading expected within established support and resistance range
Over the next 2–3 trading days, price action is expected to consolidate within the C$273.96 to C$287.1 range, which represents a typical volatility band relative to current levels. The baseline scenario envisions continued sideways movement. A break above C$287.1 would signal renewed momentum to the upside, while a decline below C$273.96 support would expose the risk of further downside, although this scenario currently appears very unlikely.
Previously it was reported that Agnico Eagle Mines' investment in Scout Discoveries offered diversification but left near-term technical direction uncertain. The latest session reinforces this cautious outlook, and with mixed momentum signals and tightening price action, traders should monitor C$287.1 as a potential breakout level for renewed directional momentum.









-
 Afghanistan
-
 Albania
-
 Algeria
-
 Angola
-
 Argentina
-
 Armenia
-
 Australia
-
 Austria
-
 Azerbaijan
-
 Bahamas
-
 Bahrain
-
 Bangladesh
-
 Belarus
-
 Belgium
-
 Bolivia
-
 Botswana
-
 Brazil
-
 Brunei
-
 Bulgaria
-
 Cambodia
-
 Cameroon
-
 Canada
-
 Chile
-
 China
-
 Colombia
-
 Congo
-
 Costa Rica
-
 Cote d'Ivoire
-
 Croatia
-
 Cuba
-
 Cyprus
-
 Czechia
-
 DR Congo
-
 Denmark
-
 Dominican Republic
-
 Ecuador
-
 Egypt
-
 El Salvador
-
 Estonia
-
 Eswatini
-
 Ethiopia
-
 Finland
-
 France
-
 Georgia
-
 Germany
-
 Ghana
-
 Greece
-
 Haiti
-
 Hong Kong
-
 Hungary
-
 India
-
 Indonesia
-
 Iran, Islamic republic
-
 Iraq
-
 Ireland
-
 Israel
-
 Italy
-
 Jamaica
-
 Japan
-
 Jordan
-
 Kazakhstan
-
 Kenya
-
 Korea
-
 Kuwait
-
 Kyrgyzstan
-
 Laos
-
 Latvia
-
 Lebanon
-
 Lesotho
-
 Libya
-
 Lithuania
-
 Luxembourg
-
 Madagascar
-
 Malaysia
-
 Malta
-
 Mauritius
-
 Mexico
-
 Moldova
-
 Mongolia
-
 Montenegro
-
 Morocco
-
 Mozambique
-
 Myanmar
-
 Namibia
-
 Nepal
-
 Netherlands
-
 New Zealand
-
 Nigeria
-
 North Macedonia
-
 Norway
-
 Oman
-
 Pakistan
-
 Palestine
-
 Panama
-
 Papua New Guinea
-
 Paraguay
-
 Peru
-
 Philippines
-
 Poland
-
 Portugal
-
 Puerto Rico
-
 Qatar
-
 Reunion
-
 Romania
-
 Rwanda
-
 Saudi Arabia
-
 Serbia
-
 Singapore
-
 Slovakia
-
 Slovenia
-
 Somalia
-
 South Africa
-
 Spain
-
 Sri Lanka
-
 Sweden
-
 Switzerland
-
 Syria
-
 Taiwan
-
 Tajikistan
-
 Tanzania
-
 Thailand
-
 Trinidad and Tobago
-
 Tunisia
-
 Turkey
-
 UAE
-
 Uganda
-
 Ukraine
-
 United Kingdom
-
United States
-
 Uruguay
-
 Uzbekistan
-
 Venezuela
-
 Vietnam
-
 Yemen
-
 Zambia
-
 Zimbabwe
- Forex
- Crypto












