

What's behind Godaddy's latest 4.3% stock pullback?

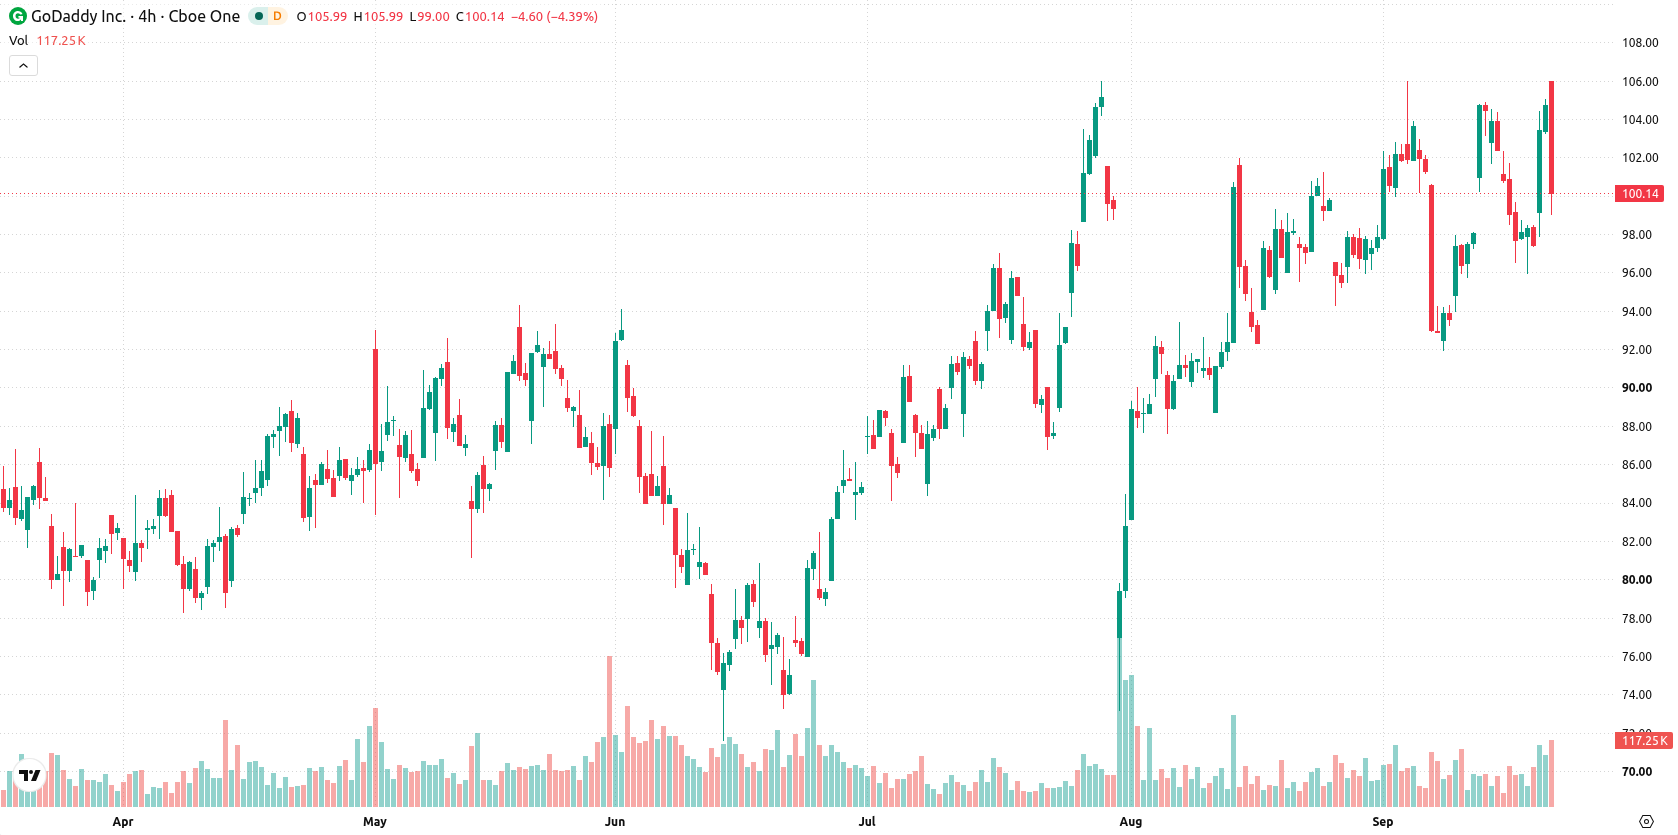
Godaddy Inc (GDDY) fell 4.32% after several law firms announced a securities fraud class action lawsuit tied to alleged customer acquisition disclosure violations. The sharp decline is supported by downside momentum even as the stock remains above all major moving averages, highlighting a contradiction between price action and its broader technical setup.
 104.41
105.35
104.41
105.35
Highlights
- Shareholders filed a securities fraud class action lawsuit against Godaddy and senior executives over alleged disclosure violations tied to customer acquisition metrics.
- The lawsuit follows a sharp drop in Godaddy stock earlier in 2026 and alleges material misstatements or omissions in investor communications.
- Godaddy stock trades above key moving averages with an expected five-day range of $95.7 to $104.78 as technical signals flag overbought conditions and trend weakness.
Legal action intensifies after share slide exposes disclosure risks
Several law firms announced the filing of a securities fraud class action lawsuit against Godaddy Inc and certain senior executives, following alleged violations of federal securities laws regarding customer acquisition disclosures. The legal action was initiated after a significant drop in share price earlier in 2026, with shareholders who purchased GDDY stock within the affected period being invited to seek a lead role in the class action and deadlines set for October 2026. The lawsuit alleges material misstatements or omissions that may have affected investor decisions.
Overbought signals clash with weak trend as buyers dominate
Godaddy is trading above its 20-day, 50-day, and 200-day moving averages ($99.16, $95.83, and $94.8 respectively), indicating positive short-term, medium-term, and long-term trends. The Ichimoku Kijun at $98.99 serves as immediate support, with near-term resistance at $104.78 and support at $99.35 defining the current trading range. Momentum is mixed: the MACD issues a buy signal, while the ADX points to weak trend strength. The RSI at 58.97, CCI at 94.32, and Stochastic RSI at 82.3 all signal overbought conditions, and Bull/Bear Power at 5.45 confirms buyers predominate, but with an overbought warning. The Awesome Oscillator is neutral, not providing a clear directional cue. The stock is down $4.53 or 4.32%, opened with an upside gap of about 1.03%, and currently trades near its daily low. Intraday volatility is 6.68%, reflecting heightened activity and pressure after the open, as downside momentum contrasts with overbought oscillators.
Previously it was reported that Godaddy’s underlying strength was tempered by ongoing legal uncertainties and mixed technical signals. The latest developments deepen the legal overhang even as technicals remain broadly supportive, making the $99.35 level a key pivot to watch for a potential breakout or breakdown in the sessions ahead.









-
 Afghanistan
-
 Albania
-
 Algeria
-
 Angola
-
 Argentina
-
 Armenia
-
 Australia
-
 Austria
-
 Azerbaijan
-
 Bahamas
-
 Bahrain
-
 Bangladesh
-
 Belarus
-
 Belgium
-
 Bolivia
-
 Botswana
-
 Brazil
-
 Brunei
-
 Bulgaria
-
 Cambodia
-
 Cameroon
-
 Canada
-
 Chile
Chile
-
 China
China
-
 Colombia
-
 Congo
Congo
-
 Costa Rica
-
 Cote d'Ivoire
-
 Croatia
-
 Cuba
Cuba
-
 Cyprus
-
 Czechia
-
 DR Congo
-
 Denmark
-
 Dominican Republic
-
 Ecuador
-
 Egypt
Egypt
-
 El Salvador
-
 Estonia
-
 Eswatini
-
 Ethiopia
-
 Finland
-
 France
-
 Georgia
-
 Germany
-
 Ghana
Ghana
-
 Greece
-
 Haiti
Haiti
-
 Hong Kong
-
 Hungary
-
 India
India
-
 Indonesia
-
 Iran, Islamic republic
-
 Iraq
Iraq
-
 Ireland
-
 Israel
-
 Italy
Italy
-
 Jamaica
-
 Japan
Japan
-
 Jordan
-
 Kazakhstan
-
 Kenya
Kenya
-
 Korea
Korea
-
 Kuwait
-
 Kyrgyzstan
-
 Laos
Laos
-
 Latvia
-
 Lebanon
-
 Lesotho
-
 Libya
Libya
-
 Lithuania
-
 Luxembourg
-
 Madagascar
-
 Malaysia
-
 Malta
Malta
-
 Mauritius
-
 Mexico
-
 Moldova
-
 Mongolia
-
 Montenegro
-
 Morocco
-
 Mozambique
-
 Myanmar
-
 Namibia
-
 Nepal
Nepal
-
 Netherlands
-
 New Zealand
-
 Nigeria
-
 North Macedonia
-
 Norway
-
 Oman
Oman
-
 Pakistan
-
 Palestine
-
 Panama
-
 Papua New Guinea
-
 Paraguay
-
 Peru
Peru
-
 Philippines
-
 Poland
-
 Portugal
-
 Puerto Rico
-
 Qatar
Qatar
-
 Reunion
-
 Romania
-
 Rwanda
-
 Saudi Arabia
-
 Serbia
-
 Singapore
-
 Slovakia
-
 Slovenia
-
 Somalia
-
 South Africa
-
 Spain
Spain
-
 Sri Lanka
-
 Sweden
-
 Switzerland
-
 Syria
Syria
-
 Taiwan
-
 Tajikistan
-
 Tanzania
-
 Thailand
-
 Trinidad and Tobago
-
 Tunisia
-
 Turkey
-
 UAE
UAE
-
 Uganda
-
 Ukraine
-
 United Kingdom
-
United States
-
 Uruguay
-
 Uzbekistan
-
 Venezuela
-
 Vietnam
-
 Yemen
Yemen
-
 Zambia
-
 Zimbabwe
- Forex
- Crypto












