


Spotify Technology S.A. (SPOT) slid 3.42% in response to reduced FY2027 earnings estimates becoming public, even as a new AI shopping partnership with Meta came into focus. The drop is further supported by sustained seller pressure, as the stock remains below key moving averages and is testing short-term support levels.
 537.90
540.81
537.90
540.81
Highlights
- Erste Group Bank reduced its FY2027 earnings estimates for Spotify, with the company reporting Q2 revenue of $5.45 billion.
- Spotify and Meta announced an AI shopping partnership, expanding their collaboration into new digital commerce applications.
- Shares of Spotify trade below key averages under seller pressure, with a forecast five-day range of $469.8 to $529.25.
Earnings downgrade outweighs AI partnership as sentiment sours
Spotify was impacted by a reduction in FY2027 earnings estimates from Erste Group Bank. The company also reported Q2 revenue of $5.45 billion. In addition, an AI shopping partnership was announced between Spotify and Meta, though price action has remained under broader selling pressure.
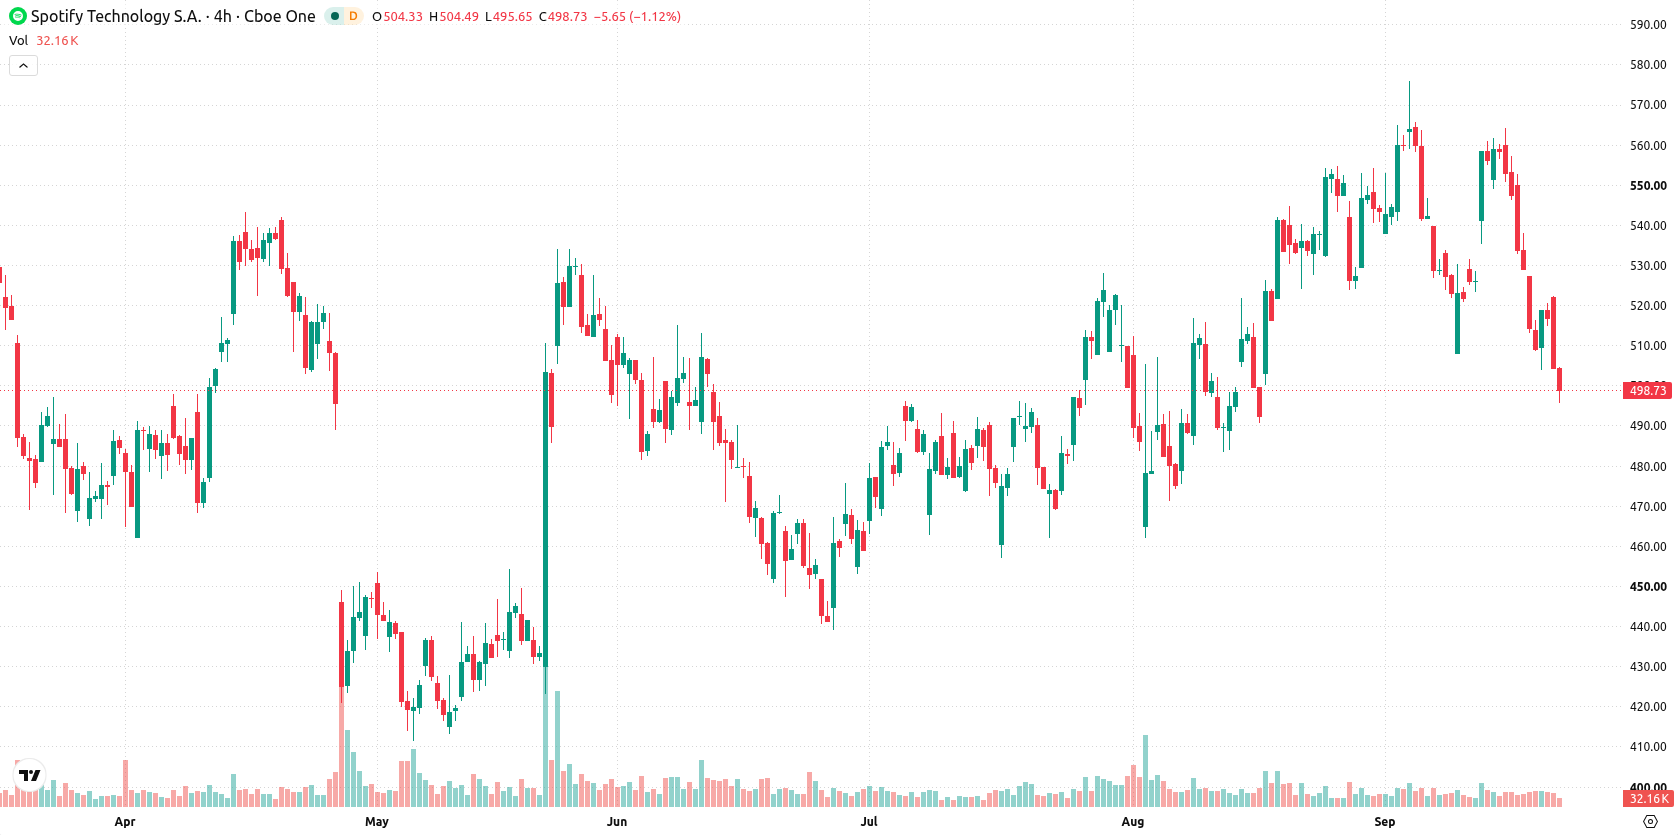
Diverging momentum signals seen as support and resistance converge
Spotify is trading below its 20-day, 50-day, and 200-day moving averages ($539.07, $513.57, and $504.11), indicating short-, medium-, and long-term pressure from sellers. Immediate technical reference levels are the near-term ceiling at $504.06 (week low) and the near-term floor at $495.61 (today low), with the broader trend remaining bullish per the 50- vs 200-day moving average alignment. Momentum indicators are showing mixed signals. The Moving Average Convergence Divergence (MACD) projects a "Strong Buy" setup, while the Average Directional Index (ADX) signals neutral trend strength. The Relative Strength Index (RSI) sits at 46, generating a "Sell" signal. Both the Stochastic RSI and Commodity Channel Index (CCI) point to oversold conditions, and Bull/Bear Power (BBP) at -11.69 confirms seller dominance intraday with an oversold forecast. Today's daily change is down, with the stock last trading at $499.53 after slipping $17.67 or 3.42%. There was an upside gap of approximately $3.19 (0.62%), but price action has faded toward the session low. Intraday volatility stands at 5.00%. The session has been marked by clear pressure after the open, with daily momentum signals diverging: strong MACD, but multiple oscillators warn of downside exhaustion.
Previously it was reported that Spotify's persistent trading below key moving averages reflected ongoing downside pressure, even as platform and partnership expansions aimed to boost engagement. The current multi-timeframe technical setup adds mixed momentum and a tighter near-term volatility band, making $495.61 a pivotal level to monitor for any renewed downside risk.





Latest Spotify News





-
 Afghanistan
-
 Albania
-
 Algeria
-
 Angola
-
 Argentina
-
 Armenia
-
 Australia
-
 Austria
-
 Azerbaijan
-
 Bahamas
-
 Bahrain
-
 Bangladesh
-
 Belarus
-
 Belgium
-
 Bolivia
-
 Botswana
-
 Brazil
-
 Brunei
-
 Bulgaria
-
 Cambodia
-
 Cameroon
-
 Canada
-
 Chile
Chile
-
 China
China
-
 Colombia
-
 Congo
Congo
-
 Costa Rica
-
 Cote d'Ivoire
-
 Croatia
-
 Cuba
Cuba
-
 Cyprus
-
 Czechia
-
 DR Congo
-
 Denmark
-
 Dominican Republic
-
 Ecuador
-
 Egypt
Egypt
-
 El Salvador
-
 Estonia
-
 Eswatini
-
 Ethiopia
-
 Finland
-
 France
-
 Georgia
-
 Germany
-
 Ghana
Ghana
-
 Greece
-
 Haiti
Haiti
-
 Hong Kong
-
 Hungary
-
 India
India
-
 Indonesia
-
 Iran, Islamic republic
-
 Iraq
Iraq
-
 Ireland
-
 Israel
-
 Italy
Italy
-
 Jamaica
-
 Japan
Japan
-
 Jordan
-
 Kazakhstan
-
 Kenya
Kenya
-
 Korea
Korea
-
 Kuwait
-
 Kyrgyzstan
-
 Laos
Laos
-
 Latvia
-
 Lebanon
-
 Lesotho
-
 Libya
Libya
-
 Lithuania
-
 Luxembourg
-
 Madagascar
-
 Malaysia
-
 Malta
Malta
-
 Mauritius
-
 Mexico
-
 Moldova
-
 Mongolia
-
 Montenegro
-
 Morocco
-
 Mozambique
-
 Myanmar
-
 Namibia
-
 Nepal
Nepal
-
 Netherlands
-
 New Zealand
-
 Nigeria
-
 North Macedonia
-
 Norway
-
 Oman
Oman
-
 Pakistan
-
 Palestine
-
 Panama
-
 Papua New Guinea
-
 Paraguay
-
 Peru
Peru
-
 Philippines
-
 Poland
-
 Portugal
-
 Puerto Rico
-
 Qatar
Qatar
-
 Reunion
-
 Romania
-
 Rwanda
-
 Saudi Arabia
-
 Serbia
-
 Singapore
-
 Slovakia
-
 Slovenia
-
 Somalia
-
 South Africa
-
 Spain
Spain
-
 Sri Lanka
-
 Sweden
-
 Switzerland
-
 Syria
Syria
-
 Taiwan
-
 Tajikistan
-
 Tanzania
-
 Thailand
-
 Trinidad and Tobago
-
 Tunisia
-
 Turkey
-
 UAE
UAE
-
 Uganda
-
 Ukraine
-
 United Kingdom
-
United States
-
 Uruguay
-
 Uzbekistan
-
 Venezuela
-
 Vietnam
-
 Yemen
Yemen
-
 Zambia
-
 Zimbabwe
- Forex
- Crypto












