

Why is AppLovin stock down today? Q2 2026 miss, AI lawsuits, and key support levels to watch

AppLovin (APP) stock is trading at $311.38, down 5.28% on the day. The stock has moved decisively lower and is currently positioned below its key moving averages, reflecting strong downward momentum.
 239.53
263.89
Highlights
- AppLovin reported Q2 revenue of $1.92 billion, missing expectations of $1.94 billion and forecasting slower sequential growth for Q3.
- Securities class action lawsuits alleging AI development misstatements increase legal and reputational risks for AppLovin and senior executives.
- Shares of AppLovin trade below key moving averages with technical indicators mostly bearish, projecting a 76% probability of a move to $297.9 in the next three days.
Revenue miss and legal challenges stoke worries over growth outlook
AppLovin reported quarterly revenue of $1.92 billion on August 5, 2026, missing consensus estimates of $1.94 billion and releasing a Q3 revenue outlook that pointed to moderating sequential growth, according to Prnewswire. At the same time, several securities class action lawsuits have been filed against AppLovin and senior executives over alleged misstatements relating to its AI development, amplifying legal and reputational risks. Separately, Edgewater research identified a stagnation in MAX ad platform metrics such as share of wallet and share of voice, as reported by Benzinga, reinforcing concerns over competitive positioning and future revenue prospects.
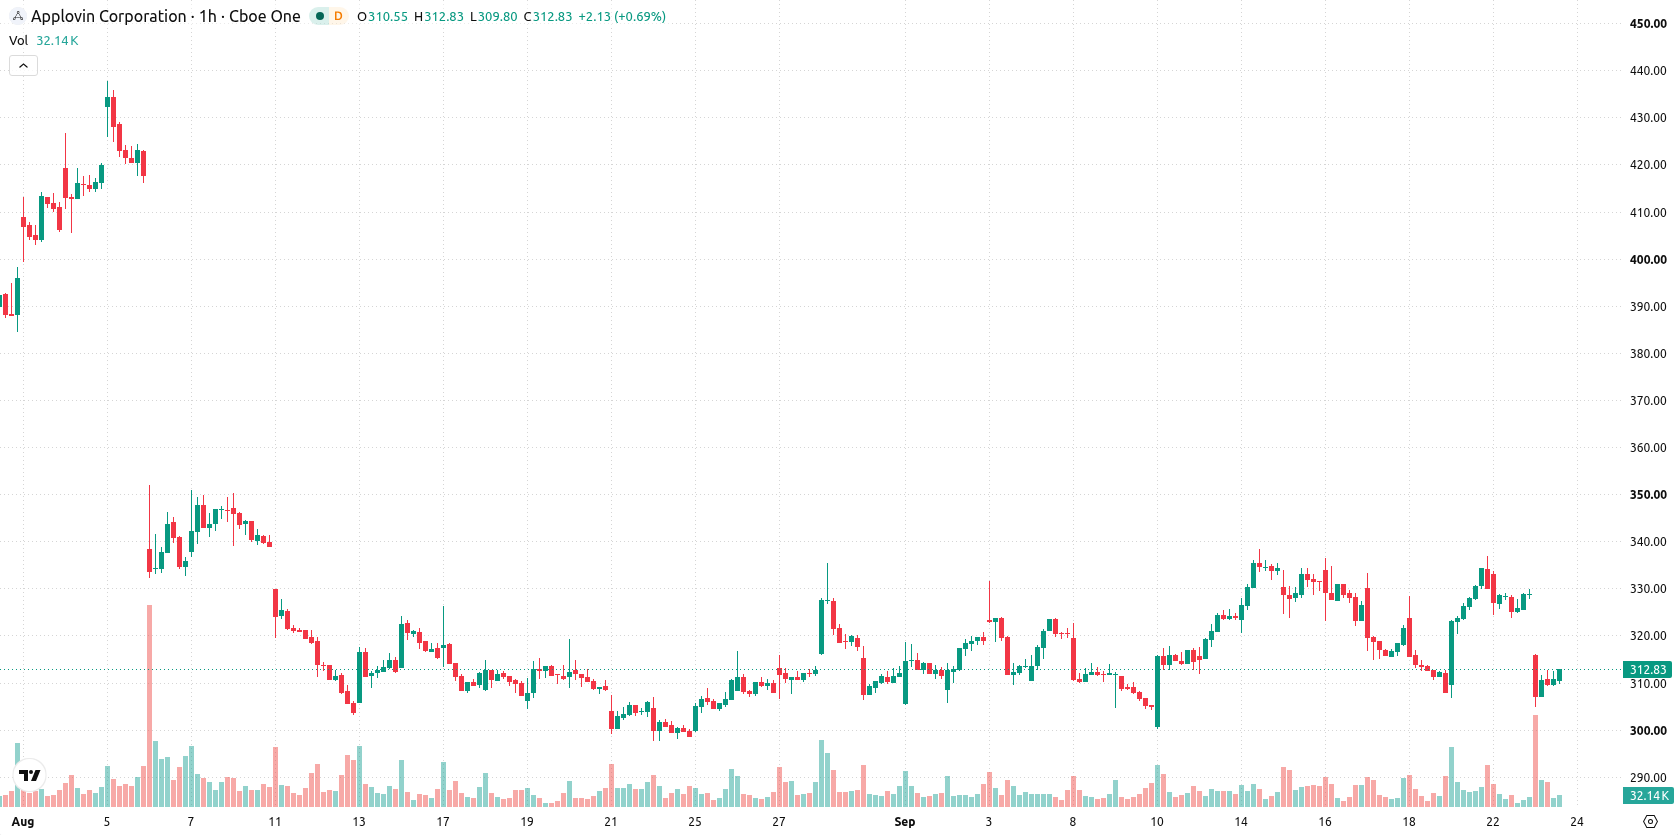
Mixed momentum with heavy selling by resistance and neutral signals
On the hourly chart, APP is trading below the MA-20 ($322.72), MA-50 ($325), and well below the longer-term MA-200 ($472.04). Immediate resistance is defined by the Ichimoku Kijun at $321.01, while a near-term support band is established just above $297.9. Momentum indicators are mixed: RSI is at 33.86, CCI and Stoch RSI are in the oversold zone, and Bull/Bear Power reflects strong seller dominance within the session. However, MACD, ADX, and the Awesome Oscillator all remain neutral, suggesting less directional conviction despite the heavy selling bias.
Downside risk prevails as consolidation favors bearish scenario
In the short term, APP is expected to consolidate between $297.9 and $324.86, reflecting typical volatility for the coming 2–3 trading days. According to scenario analysis, the probability of an upward move stands at 24%, while a downward move is much more likely at 76%. The bullish case would require a break above resistance at $321.01, whereas the bearish scenario could develop rapidly if price falls below $297.9.
Earlier, analysts noted that AppLovin faced sustained technical pressure and heightened legal scrutiny, with risks skewed to the downside. The latest trading action maintains this negative bias, and traders should closely watch the $297.9 support level, a potential trigger for accelerated downside if breached in the near term.






Latest AppLovin News





-
 Afghanistan
-
 Albania
-
 Algeria
-
 Angola
-
 Argentina
-
 Armenia
-
 Australia
-
 Austria
-
 Azerbaijan
-
 Bahamas
-
 Bahrain
-
 Bangladesh
-
 Belarus
-
 Belgium
-
 Bolivia
-
 Botswana
-
 Brazil
-
 Brunei
-
 Bulgaria
-
 Cambodia
-
 Cameroon
-
 Canada
-
 Chile
-
 China
-
 Colombia
-
 Congo
-
 Costa Rica
-
 Cote d'Ivoire
-
 Croatia
-
 Cuba
-
 Cyprus
-
 Czechia
-
 DR Congo
-
 Denmark
-
 Dominican Republic
-
 Ecuador
-
 Egypt
-
 El Salvador
-
 Estonia
-
 Eswatini
-
 Ethiopia
-
 Finland
-
 France
-
 Georgia
-
 Germany
-
 Ghana
-
 Greece
-
 Haiti
-
 Hong Kong
-
 Hungary
-
 India
-
 Indonesia
-
 Iran, Islamic republic
-
 Iraq
-
 Ireland
-
 Israel
-
 Italy
-
 Jamaica
-
 Japan
-
 Jordan
-
 Kazakhstan
-
 Kenya
-
 Korea
-
 Kuwait
-
 Kyrgyzstan
-
 Laos
-
 Latvia
-
 Lebanon
-
 Lesotho
-
 Libya
-
 Lithuania
-
 Luxembourg
-
 Madagascar
-
 Malaysia
-
 Malta
-
 Mauritius
-
 Mexico
-
 Moldova
-
 Mongolia
-
 Montenegro
-
 Morocco
-
 Mozambique
-
 Myanmar
-
 Namibia
-
 Nepal
-
 Netherlands
-
 New Zealand
-
 Nigeria
-
 North Macedonia
-
 Norway
-
 Oman
-
 Pakistan
-
 Palestine
-
 Panama
-
 Papua New Guinea
-
 Paraguay
-
 Peru
-
 Philippines
-
 Poland
-
 Portugal
-
 Puerto Rico
-
 Qatar
-
 Reunion
-
 Romania
-
 Rwanda
-
 Saudi Arabia
-
 Serbia
-
 Singapore
-
 Slovakia
-
 Slovenia
-
 Somalia
-
 South Africa
-
 Spain
-
 Sri Lanka
-
 Sweden
-
 Switzerland
-
 Syria
-
 Taiwan
-
 Tajikistan
-
 Tanzania
-
 Thailand
-
 Trinidad and Tobago
-
 Tunisia
-
 Turkey
-
 UAE
-
 Uganda
-
 Ukraine
-
 United Kingdom
-
United States
-
 Uruguay
-
 Uzbekistan
-
 Venezuela
-
 Vietnam
-
 Yemen
-
 Zambia
-
 Zimbabwe
- Forex
- Crypto












