

Affirm stock falls nearly 5% as selling pressure intensifies despite strong earnings beat

Affirm Holdings, Inc. (AFRM) dropped 4.8% after reporting quarterly revenue of $1.07 billion and $4.62 earnings per share, both ahead of analyst expectations. The move is supported by short- and medium-term technical pressure, with the stock trading below its 20-day and 50-day moving averages while remaining above the 200-day.
 73.65
76.13
Highlights
- Affirm reported quarterly revenue of $1.07 billion and earnings of $4.62 per share, surpassing analyst projections.
- Corient Private Wealth LP doubled its stake in Affirm and Nykredit A S initiated a new $6 million position.
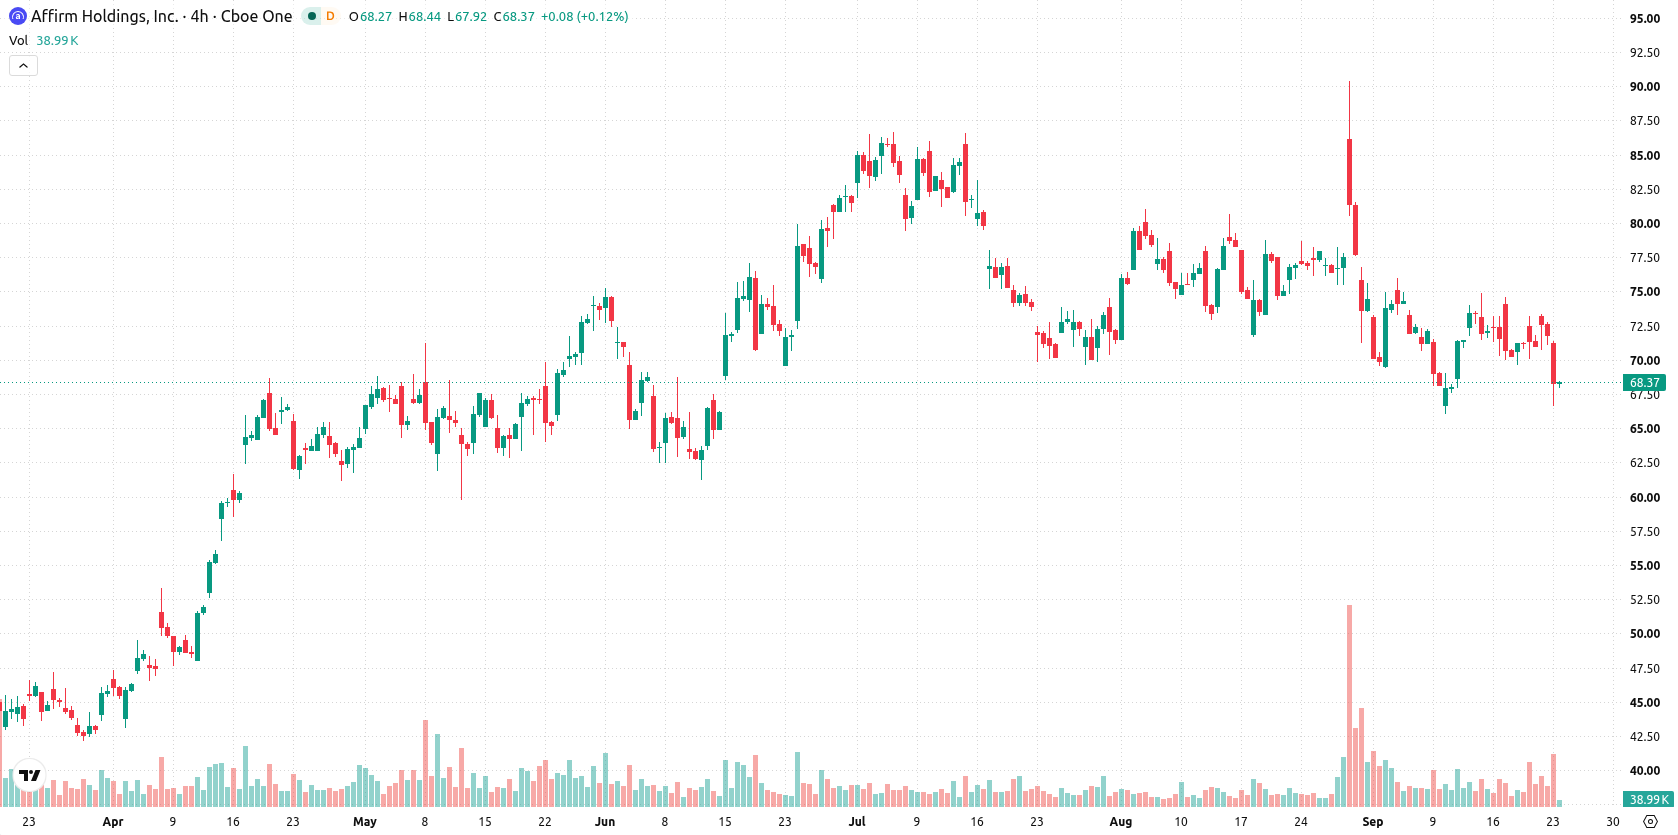
- Affirm stock declined 4.8% to $68.33, trades below key short- and medium-term averages, and is expected to range from $63.5 to $70.47 over the next week.
Institutional inflows rise as selling persists amid strong results
Affirm reported $1.07 billion in quarterly revenue and $4.62 earnings per share in its latest results, exceeding analyst expectations. Institutional activity was notable as Corient Private Wealth LP increased its stake by 101.4% and Nykredit A S took a new $6 million position. These developments were accompanied by the current selling pressure in the stock, though price action has remained under broader selling pressure.
Short-term weakness persists as mixed signals cloud long-term uptrend
Affirm is currently trading below its 20-day ($72.79) and 50-day ($74.49) moving averages, but remains above the 200-day ($66.72), indicating downward pressure in the short and medium term while preserving a bullish long-term structure. The near-term ceiling stands at $69.75 with support at the 200-day moving average of $66.72; distant resistance levels, including the Ichimoku Kijun ($77.93), confirm the prevailing longer-term trend. Momentum readings are mixed: the MACD signals strong downward momentum, while the Average Directional Index (ADX) indicates a neutral trend. The Relative Strength Index (RSI) is moderately neutral at 47.13 but forecasts a sell signal, and the Stochastic RSI is in overbought territory at 82.1. Commodity Channel Index (CCI) reads neutral. Bull/Bear Power (BBP) at 1.54 confirms buyers dominate intraday action but also signals overbought conditions. The Awesome Oscillator (AO) supports the ongoing negative move with a sell signal. Today the stock is down, with a last price of $68.33 after declining $3.44 or 4.8%, and opened with a downside gap of about $0.61 (0.85%). The price is mid-range for the session, with intraday volatility at 7.25%. The intraday tone shows pressure after the open, matching the prevailing negative momentum.
Earlier, analysts noted that Affirm's technical picture had shifted toward increased downside risk, with the stock showing vulnerability to further declines despite supportive longer-term factors. The current article adds further weight to this outlook by highlighting persistent short- and medium-term technical pressure, underscoring the importance of the $66.72 support level as a key threshold for potential downside movement in the coming sessions.










-
 Afghanistan
-
 Albania
-
 Algeria
-
 Angola
-
 Argentina
-
 Armenia
-
 Australia
-
 Austria
-
 Azerbaijan
-
 Bahamas
-
 Bahrain
-
 Bangladesh
-
 Belarus
-
 Belgium
-
 Bolivia
-
 Botswana
-
 Brazil
-
 Brunei
-
 Bulgaria
-
 Cambodia
-
 Cameroon
-
 Canada
-
 Chile
-
 China
-
 Colombia
-
 Congo
-
 Costa Rica
-
 Cote d'Ivoire
-
 Croatia
-
 Cuba
-
 Cyprus
-
 Czechia
-
 DR Congo
-
 Denmark
-
 Dominican Republic
-
 Ecuador
-
 Egypt
-
 El Salvador
-
 Estonia
-
 Eswatini
-
 Ethiopia
-
 Finland
-
 France
-
 Georgia
-
 Germany
-
 Ghana
-
 Greece
-
 Haiti
-
 Hong Kong
-
 Hungary
-
 India
-
 Indonesia
-
 Iran, Islamic republic
-
 Iraq
-
 Ireland
-
 Israel
-
 Italy
-
 Jamaica
-
 Japan
-
 Jordan
-
 Kazakhstan
-
 Kenya
-
 Korea
-
 Kuwait
-
 Kyrgyzstan
-
 Laos
-
 Latvia
-
 Lebanon
-
 Lesotho
-
 Libya
-
 Lithuania
-
 Luxembourg
-
 Madagascar
-
 Malaysia
-
 Malta
-
 Mauritius
-
 Mexico
-
 Moldova
-
 Mongolia
-
 Montenegro
-
 Morocco
-
 Mozambique
-
 Myanmar
-
 Namibia
-
 Nepal
-
 Netherlands
-
 New Zealand
-
 Nigeria
-
 North Macedonia
-
 Norway
-
 Oman
-
 Pakistan
-
 Palestine
-
 Panama
-
 Papua New Guinea
-
 Paraguay
-
 Peru
-
 Philippines
-
 Poland
-
 Portugal
-
 Puerto Rico
-
 Qatar
-
 Reunion
-
 Romania
-
 Rwanda
-
 Saudi Arabia
-
 Serbia
-
 Singapore
-
 Slovakia
-
 Slovenia
-
 Somalia
-
 South Africa
-
 Spain
-
 Sri Lanka
-
 Sweden
-
 Switzerland
-
 Syria
-
 Taiwan
-
 Tajikistan
-
 Tanzania
-
 Thailand
-
 Trinidad and Tobago
-
 Tunisia
-
 Turkey
-
 UAE
-
 Uganda
-
 Ukraine
-
 United Kingdom
-
United States
-
 Uruguay
-
 Uzbekistan
-
 Venezuela
-
 Vietnam
-
 Yemen
-
 Zambia
-
 Zimbabwe
- Forex
- Crypto












