

Best Buy stock slips below $89.61 support as short-term downtrend dominates price action

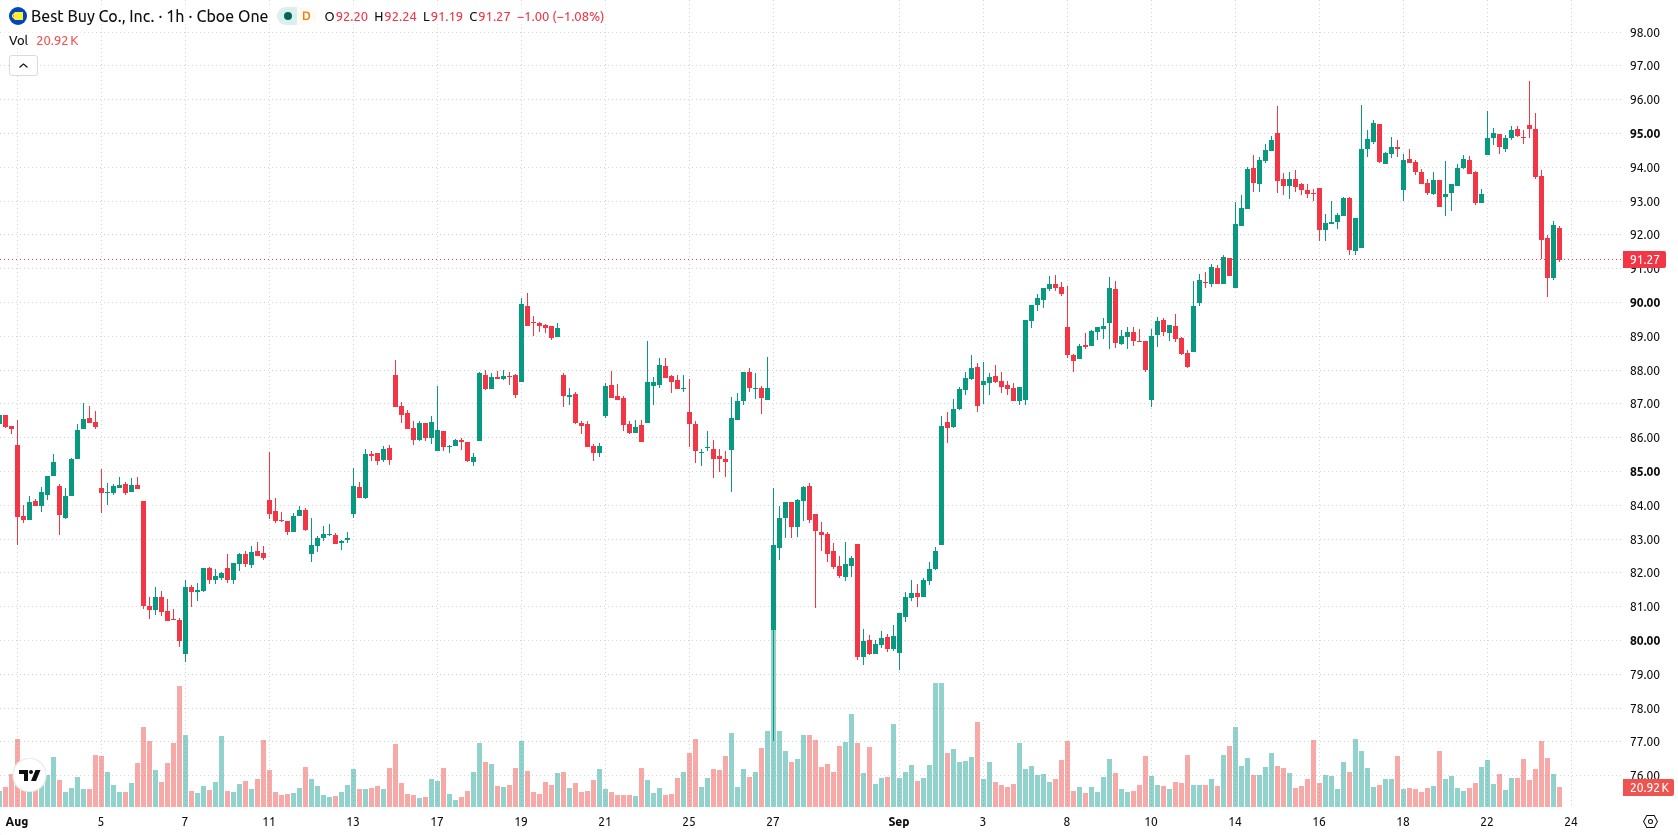
Best Buy (BBY) stock is trading at $91.00 after a 4.06% drop today, marking a decisive decline that leaves the price below its short- and medium-term moving averages while staying above long-term support.
 98.66
100.45
Highlights
- Best Buy and Amazon advanced their Fire TV partnership to allow Best Buy Ads to manage advertising slots on Insignia televisions, expanding non-retail revenue potential.
- Best Buy Canada selected RELEX Solutions for automated forecasting and replenishment, targeting improved inventory visibility and omnichannel planning efficiency.
- Shares of Best Buy fell 4.06% to $91, with technical signals showing bearish pressure and a forecast range of $89.61 to $93.91 over the next sessions.
New ad partnership and supply upgrades weighed down by risk-off sentiment
Best Buy and Amazon have expanded their Fire TV partnership, enabling Best Buy Ads to sell connected TV advertising slots on Insignia televisions, which are Best Buy's private label products, according to Moneycheck. This development provides the company with a new avenue for non-retail revenue, leveraging its existing device footprint and Amazon's distribution scale, though realized upside will depend on advertiser demand and platform adoption. In a separate move, Best Buy Canada has selected RELEX Solutions to optimize forecasting and replenishment, targeting greater inventory visibility and automated planning to support omnichannel operations across its network. While these initiatives expand future revenue possibilities and operational efficiency, price action has remained under broader selling pressure.
Short-term weakness as mixed momentum meets resistance at $93.6
On the H1 chart, BBY is trading below both the MA-20 at $94.01 and MA-50 at $93.79, highlighting current intraday and short-term weakness, while the daily chart places price above the MA-200 at $72.32. Immediate resistance is marked by the Ichimoku Kijun at $93.6. Momentum indicators present a mixed picture: MACD is on a Strong Buy signal, ADX remains Neutral, and the RSI reads 38.31, aligning with a Sell bias. Both Stochastic RSI and CCI are in oversold territory, pointing to short-term seller exhaustion, while Bull/Bear Power confirms intraday dominance by sellers. The Awesome Oscillator is Neutral, providing no clear trend confirmation.
Directional breakout risk capped by narrow volatility corridor
Over the coming sessions, BBY is likely to remain within the current volatility band, with a forecast range of $89.61 to $93.91. The probability of a downward move stands at 63%, while the chance of an upward rebound is currently 37%. Sustained trading within this corridor is expected unless price action overcomes $93.6 on the upside or breaks below $89.61, each triggering renewed directional momentum.
Earlier, analysts noted that despite sector headwinds, Best Buy's strong technical support and expanded partnership with Amazon positioned the stock for potential resilience. The current setup, reflecting ongoing sell pressure and mixed momentum signals amid new revenue and operational initiatives, makes the $89.61–$93.91 range critical for traders monitoring directional shifts in the coming sessions.






Latest Best Buy Co News





-
 Afghanistan
-
 Albania
-
 Algeria
-
 Angola
-
 Argentina
-
 Armenia
-
 Australia
-
 Austria
-
 Azerbaijan
-
 Bahamas
-
 Bahrain
-
 Bangladesh
-
 Belarus
-
 Belgium
-
 Bolivia
-
 Botswana
-
 Brazil
-
 Brunei
-
 Bulgaria
-
 Cambodia
-
 Cameroon
-
 Canada
-
 Chile
-
 China
-
 Colombia
-
 Congo
-
 Costa Rica
-
 Cote d'Ivoire
-
 Croatia
-
 Cuba
-
 Cyprus
-
 Czechia
-
 DR Congo
-
 Denmark
-
 Dominican Republic
-
 Ecuador
-
 Egypt
-
 El Salvador
-
 Estonia
-
 Eswatini
-
 Ethiopia
-
 Finland
-
 France
-
 Georgia
-
 Germany
-
 Ghana
-
 Greece
-
 Haiti
-
 Hong Kong
-
 Hungary
-
 India
-
 Indonesia
-
 Iran, Islamic republic
-
 Iraq
-
 Ireland
-
 Israel
-
 Italy
-
 Jamaica
-
 Japan
-
 Jordan
-
 Kazakhstan
-
 Kenya
-
 Korea
-
 Kuwait
-
 Kyrgyzstan
-
 Laos
-
 Latvia
-
 Lebanon
-
 Lesotho
-
 Libya
-
 Lithuania
-
 Luxembourg
-
 Madagascar
-
 Malaysia
-
 Malta
-
 Mauritius
-
 Mexico
-
 Moldova
-
 Mongolia
-
 Montenegro
-
 Morocco
-
 Mozambique
-
 Myanmar
-
 Namibia
-
 Nepal
-
 Netherlands
-
 New Zealand
-
 Nigeria
-
 North Macedonia
-
 Norway
-
 Oman
-
 Pakistan
-
 Palestine
-
 Panama
-
 Papua New Guinea
-
 Paraguay
-
 Peru
-
 Philippines
-
 Poland
-
 Portugal
-
 Puerto Rico
-
 Qatar
-
 Reunion
-
 Romania
-
 Rwanda
-
 Saudi Arabia
-
 Serbia
-
 Singapore
-
 Slovakia
-
 Slovenia
-
 Somalia
-
 South Africa
-
 Spain
-
 Sri Lanka
-
 Sweden
-
 Switzerland
-
 Syria
-
 Taiwan
-
 Tajikistan
-
 Tanzania
-
 Thailand
-
 Trinidad and Tobago
-
 Tunisia
-
 Turkey
-
 UAE
-
 Uganda
-
 Ukraine
-
 United Kingdom
-
United States
-
 Uruguay
-
 Uzbekistan
-
 Venezuela
-
 Vietnam
-
 Yemen
-
 Zambia
-
 Zimbabwe
- Forex
- Crypto












