

Arm stock forecast: Overbought conditions and $301.2 support in focus

Arm (ARM) stock is trading at $332.56, recording a marginal dip in the latest session. The price remains above its key short- and long-term moving averages, indicating a generally supportive technical environment.
 208.80
236.95
Highlights
- Shares of Arm have attracted strong AI-related interest from institutional and retail investors due to involvement in Meta's Muse AI agent and AGI CPU partnerships.
- Arm stock carries a forward price/earnings ratio near 143, exposing it to potential volatility as investors weigh growth expectations.
- Arm stock trades with strong bullish momentum and elevated buy signals, with a projected near-term range of $296.9 to $368.22.
AI partnerships and valuation concerns drive investor focus and volatility
Recent activity in Arm has been shaped by strong AI-related momentum and renewed investor interest, following company involvement in Meta's Muse AI agent and a partnership linked to AGI CPUs, according to Investing.com. These developments have expanded the company's role within next-generation AI applications, prompting heightened attention from both institutional and retail segments. Meanwhile, Arm remains priced at an elevated valuation, with a forward price/earnings ratio around 143 times as noted by Gurufocus, which may increase its exposure to volatility as investors weigh near-term news against longer-term growth assumptions.
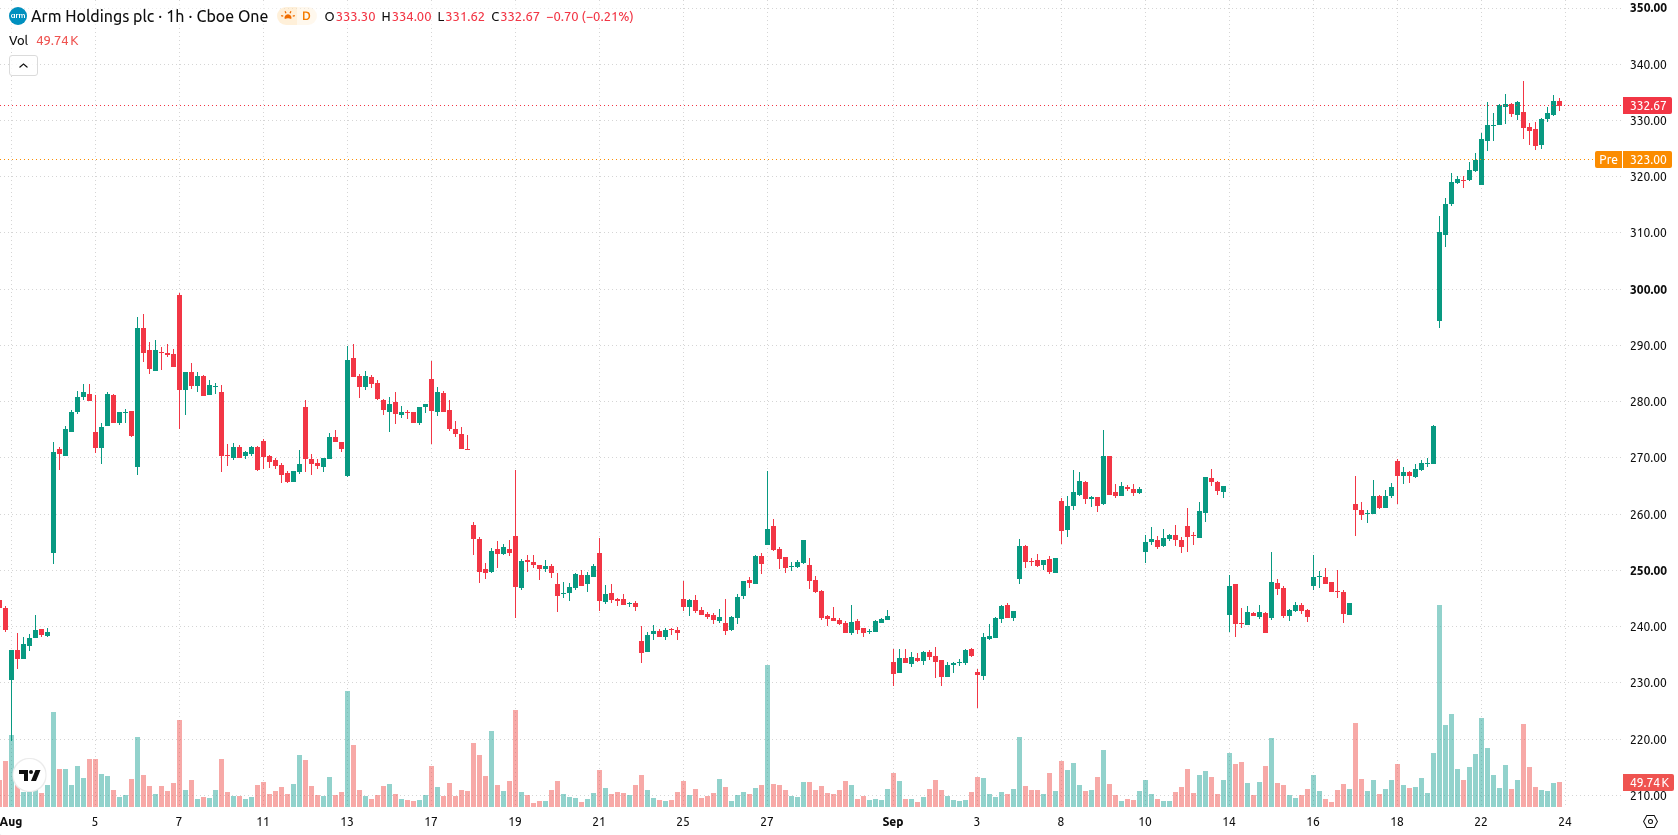
Bullish signals hold as momentum stays strong above support levels
On the hourly chart, ARM trades above its MA-20 at $327.12 and MA-50 at $284.79, maintaining a strong technical posture well above the MA-200 at $210.15. The Ichimoku Kijun sits at $301.2, marking the closest immediate support zone. Momentum readings remain robust: MACD is at Strong Buy, ADX also indicates a strong trend, RSI registers above 76 (Buy), and both CCI and Bull/Bear Power are supportive. In contrast, Stochastic RSI reflects an oversold state, highlighting potential for short-term consolidation despite prevailing bullish signals.
Rangebound outlook expected amid stable technical backdrop
Looking ahead, ARM's price is projected to fluctuate within a $296.9 to $368.22 range over the coming days. The most probable scenario is for the stock to stabilize within this corridor, supported by current technical factors. A break above the upper band could open the way for further gains toward the forecast high, while a decline below support at $301.2 would signal the risk of a pullback, though this is presently viewed as unlikely.
Earlier, analysts noted that Arm had established a constructive technical backdrop, outperforming broader semiconductor benchmarks as a rebound took hold in the sector. Building on that assessment, the current setup highlights rising momentum from Arm's expanding AI partnerships, positioning $301.2 as a critical support level to monitor for potential shifts in near-term trend direction.










-
 Afghanistan
-
 Albania
-
 Algeria
-
 Angola
-
 Argentina
-
 Armenia
-
 Australia
-
 Austria
-
 Azerbaijan
-
 Bahamas
-
 Bahrain
-
 Bangladesh
-
 Belarus
-
 Belgium
-
 Bolivia
-
 Botswana
-
 Brazil
-
 Brunei
-
 Bulgaria
-
 Cambodia
-
 Cameroon
-
 Canada
-
 Chile
-
 China
-
 Colombia
-
 Congo
-
 Costa Rica
-
 Cote d'Ivoire
-
 Croatia
-
 Cuba
-
 Cyprus
-
 Czechia
-
 DR Congo
-
 Denmark
-
 Dominican Republic
-
 Ecuador
-
 Egypt
-
 El Salvador
-
 Estonia
-
 Eswatini
-
 Ethiopia
-
 Finland
-
 France
-
 Georgia
-
 Germany
-
 Ghana
-
 Greece
-
 Haiti
-
 Hong Kong
-
 Hungary
-
 India
-
 Indonesia
-
 Iran, Islamic republic
-
 Iraq
-
 Ireland
-
 Israel
-
 Italy
-
 Jamaica
-
 Japan
-
 Jordan
-
 Kazakhstan
-
 Kenya
-
 Korea
-
 Kuwait
-
 Kyrgyzstan
-
 Laos
-
 Latvia
-
 Lebanon
-
 Lesotho
-
 Libya
-
 Lithuania
-
 Luxembourg
-
 Madagascar
-
 Malaysia
-
 Malta
-
 Mauritius
-
 Mexico
-
 Moldova
-
 Mongolia
-
 Montenegro
-
 Morocco
-
 Mozambique
-
 Myanmar
-
 Namibia
-
 Nepal
-
 Netherlands
-
 New Zealand
-
 Nigeria
-
 North Macedonia
-
 Norway
-
 Oman
-
 Pakistan
-
 Palestine
-
 Panama
-
 Papua New Guinea
-
 Paraguay
-
 Peru
-
 Philippines
-
 Poland
-
 Portugal
-
 Puerto Rico
-
 Qatar
-
 Reunion
-
 Romania
-
 Rwanda
-
 Saudi Arabia
-
 Serbia
-
 Singapore
-
 Slovakia
-
 Slovenia
-
 Somalia
-
 South Africa
-
 Spain
-
 Sri Lanka
-
 Sweden
-
 Switzerland
-
 Syria
-
 Taiwan
-
 Tajikistan
-
 Tanzania
-
 Thailand
-
 Trinidad and Tobago
-
 Tunisia
-
 Turkey
-
 UAE
-
 Uganda
-
 Ukraine
-
 United Kingdom
-
United States
-
 Uruguay
-
 Uzbekistan
-
 Venezuela
-
 Vietnam
-
 Yemen
-
 Zambia
-
 Zimbabwe
- Forex
- Crypto












