

Seller pressure at GBX4,978: Can RKT break resistance?

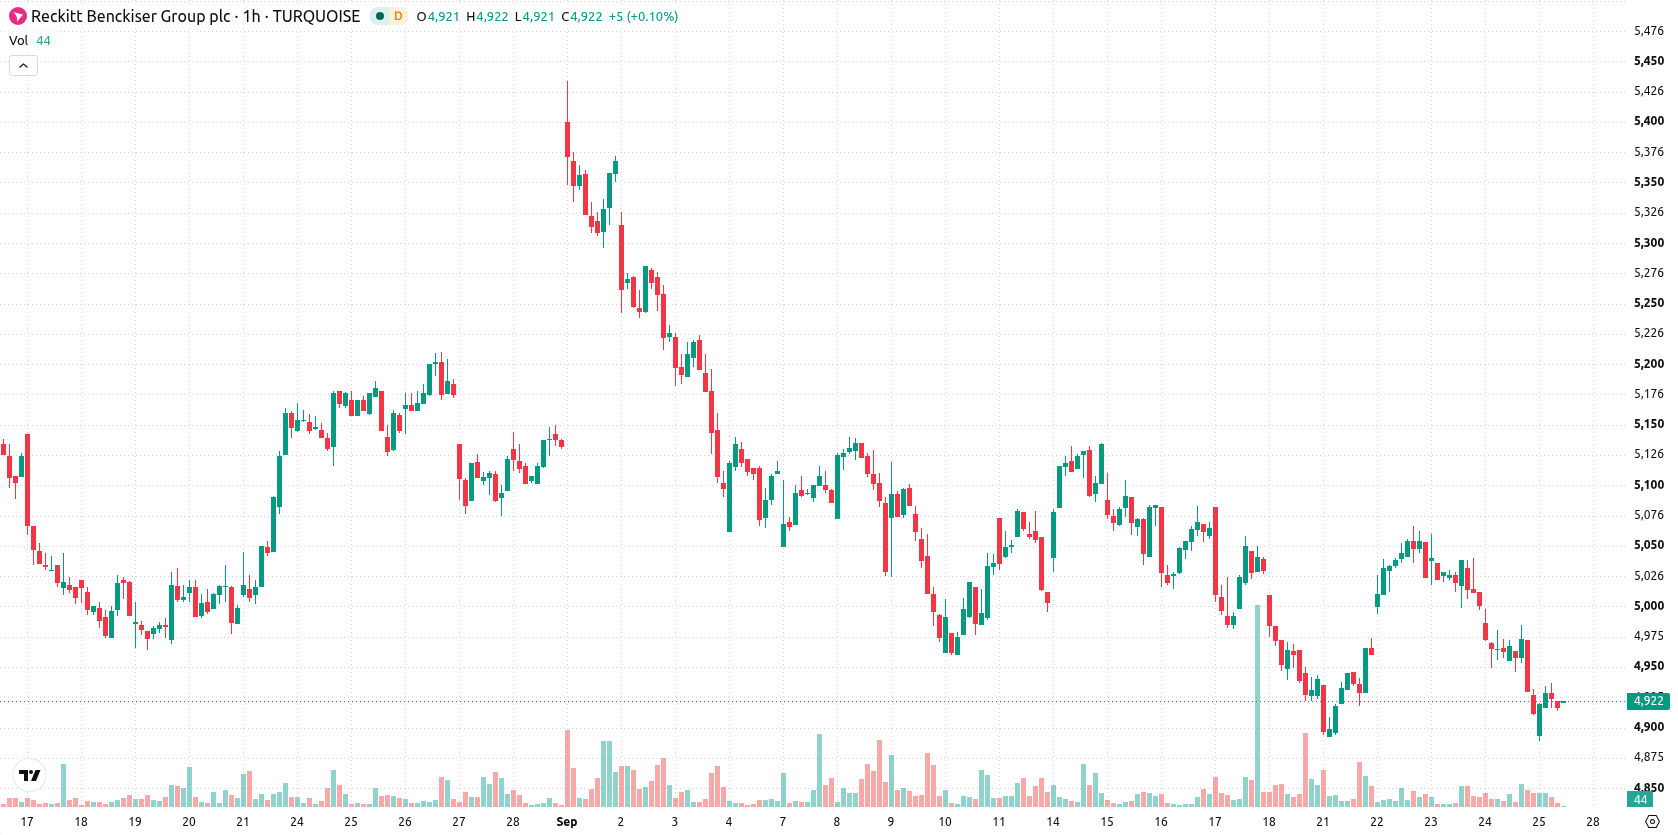
Reckitt Benckiser (RKT) stock is trading at GBX4,934, posting a slight gain for the session. The move leaves the price below its key short-, medium-, and long-term moving averages.
 5672.00
5748.00
Highlights
- RKT/GBX stock trades below key short and long-term moving averages, confirming persistent bearish momentum across all timeframes.
- Bearish signals dominate among momentum indicators, with sellers maintaining control and oscillators showing oversold conditions.
- Price action is likely to remain within GBX4,856 to GBX5,011 for the next sessions, with a high probability of further downside.
Multiple sell signals intensify below resistance amid neutral momentum
On the hourly timeframe, RKT/GBX is trading below the MA-20 at GBX4,971 and the MA-50 at GBX4,976. The price also remains below the long-term MA-200 at GBX5,327, with the Ichimoku Kijun at GBX4,978 acting as the nearest resistance. Momentum indicators show pronounced selling signals: MACD points to continued selling pressure, the ADX is neutral, and the RSI is at 34.62, flagged as 'Sell'. CCI is in oversold territory, Bull/Bear Power reveals seller dominance, and the Stochastic RSI remains neutral. The Awesome Oscillator confirms the prevailing negative bias, while intraday volatility stays low. Price action has also seen a minor opening gap of -22, with current levels hugging the session high.
Downside risk heightened as consolidation signals persist
For the near term, RKT is expected to consolidate within a typical volatility band of GBX4,856 to GBX5,011. The current outlook indicates a much higher probability of further downside than a rebound. Should the price break above GBX4,978 (the Kijun level), a move toward resistance at GBX5,011 is likely. Conversely, a decisive drop below GBX4,856 would put sellers firmly in control, increasing the risk of deeper declines.
Earlier, analysts noted that Reckitt Benckiser shares showed ongoing indecision, with price action constrained by resistance and lacking clear trend momentum. The latest technical data reinforce this cautious tone, with downside risk prevailing and a decisive move below GBX4,856 emerging as the critical level to monitor for further weakness.










-
 Afghanistan
-
 Albania
-
 Algeria
-
 Angola
-
 Argentina
-
 Armenia
-
 Australia
-
 Austria
-
 Azerbaijan
-
 Bahamas
-
 Bahrain
-
 Bangladesh
-
 Belarus
-
 Belgium
-
 Bolivia
-
 Botswana
-
 Brazil
-
 Brunei
-
 Bulgaria
-
 Cambodia
-
 Cameroon
-
 Canada
-
 Chile
-
 China
-
 Colombia
-
 Congo
-
 Costa Rica
-
 Cote d'Ivoire
-
 Croatia
-
 Cuba
-
 Cyprus
-
 Czechia
-
 DR Congo
-
 Denmark
-
 Dominican Republic
-
 Ecuador
-
 Egypt
-
 El Salvador
-
 Estonia
-
 Eswatini
-
 Ethiopia
-
 Finland
-
 France
-
 Georgia
-
 Germany
-
 Ghana
-
 Greece
-
 Haiti
-
 Hong Kong
-
 Hungary
-
 India
-
 Indonesia
-
 Iran, Islamic republic
-
 Iraq
-
 Ireland
-
 Israel
-
 Italy
-
 Jamaica
-
 Japan
-
 Jordan
-
 Kazakhstan
-
 Kenya
-
 Korea
-
 Kuwait
-
 Kyrgyzstan
-
 Laos
-
 Latvia
-
 Lebanon
-
 Lesotho
-
 Libya
-
 Lithuania
-
 Luxembourg
-
 Madagascar
-
 Malaysia
-
 Malta
-
 Mauritius
-
 Mexico
-
 Moldova
-
 Mongolia
-
 Montenegro
-
 Morocco
-
 Mozambique
-
 Myanmar
-
 Namibia
-
 Nepal
-
 Netherlands
-
 New Zealand
-
 Nigeria
-
 North Macedonia
-
 Norway
-
 Oman
-
 Pakistan
-
 Palestine
-
 Panama
-
 Papua New Guinea
-
 Paraguay
-
 Peru
-
 Philippines
-
 Poland
-
 Portugal
-
 Puerto Rico
-
 Qatar
-
 Reunion
-
 Romania
-
 Rwanda
-
 Saudi Arabia
-
 Serbia
-
 Singapore
-
 Slovakia
-
 Slovenia
-
 Somalia
-
 South Africa
-
 Spain
-
 Sri Lanka
-
 Sweden
-
 Switzerland
-
 Syria
-
 Taiwan
-
 Tajikistan
-
 Tanzania
-
 Thailand
-
 Trinidad and Tobago
-
 Tunisia
-
 Turkey
-
 UAE
-
 Uganda
-
 Ukraine
-
 United Kingdom
-
United States
-
 Uruguay
-
 Uzbekistan
-
 Venezuela
-
 Vietnam
-
 Yemen
-
 Zambia
-
 Zimbabwe
- Forex
- Crypto












