

Reckitt Benckiser shares technical analysis: Consolidation near GBX5,750 resistance

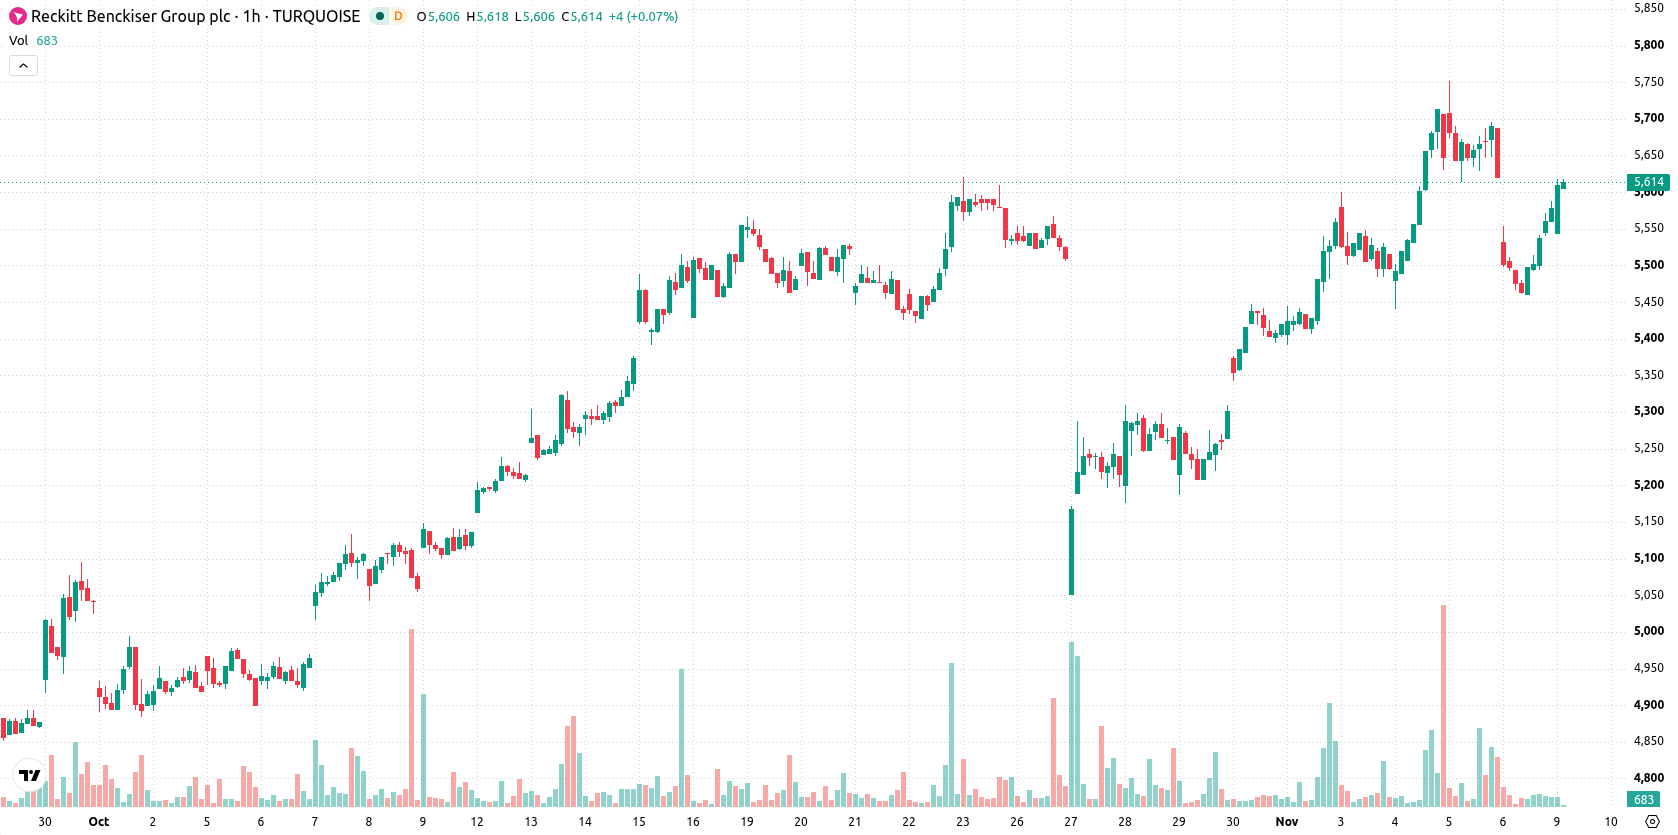
Reckitt Benckiser (RKT) stock is trading at GBX5,614, posting a modest gain on the day and currently hovering near the session high. The price remains above its key moving averages, reflecting ongoing technical strength against both short- and long-term trend indicators.
 5612.00
5748.00
Highlights
- RKT/GBX holds above key short-, medium-, and long-term moving averages, indicating an established upward technical trend.
- MACD and ADX indicate underlying bearish pressure, but intraday buyers show strength with Bull/Bear Power positive and rising prices.
- Expected trading range is GBX5,477 to GBX5,750 in the coming sessions, with a very high probability of upward movement and low intraday volatility.
Buyer strength endures as mixed momentum signals diverge
On the technical front, RKT is trading above the MA-20 at GBX5,591 and MA-50 at GBX5,541 on the working timeframe, as well as above the MA-200 at GBX5,208 on the daily chart. The Ichimoku Kijun serves as immediate support at GBX5,501. Momentum indicators signal mixed conditions: MACD and ADX both point to a Sell, while RSI, Stoch RSI, and CCI all indicate neutral momentum. Bull/Bear Power stands positive at 46.06, highlighting intraday buyer strength despite underlying medium-term weakness reflected by MACD.
Bullish bias strengthens as breakout risk outweighs downside
Looking ahead, the typical volatility band for RKT is expected between GBX5,477 and GBX5,750 over the next few sessions. The probability of upward continuation is very high, while the likelihood of a significant decline remains low. The baseline scenario is for the price to stabilize within this established corridor, with a bullish breakout targeting new highs and a bearish case only triggered if support at the Ichimoku Kijun fails.
Earlier, analysts noted that Reckitt Benckiser was at risk of further short-term downside while longer-term technical support remained intact. The latest technical setup signals a shift toward renewed strength, with traders advised to monitor the Ichimoku Kijun as a key support level for any change in trend momentum.










-
 Afghanistan
-
 Albania
-
 Algeria
-
 Angola
-
 Argentina
-
 Armenia
-
 Australia
-
 Austria
-
 Azerbaijan
-
 Bahamas
-
 Bahrain
-
 Bangladesh
-
 Belarus
-
 Belgium
-
 Bolivia
-
 Botswana
-
 Brazil
-
 Brunei
-
 Bulgaria
-
 Cambodia
-
 Cameroon
-
 Canada
-
 Chile
-
 China
-
 Colombia
-
 Congo
-
 Costa Rica
-
 Cote d'Ivoire
-
 Croatia
-
 Cuba
-
 Cyprus
-
 Czechia
-
 DR Congo
-
 Denmark
-
 Dominican Republic
-
 Ecuador
-
 Egypt
-
 El Salvador
-
 Estonia
-
 Eswatini
-
 Ethiopia
-
 Finland
-
 France
-
 Georgia
-
 Germany
-
 Ghana
-
 Greece
-
 Haiti
-
 Hong Kong
-
 Hungary
-
 India
-
 Indonesia
-
 Iran, Islamic republic
-
 Iraq
-
 Ireland
-
 Israel
-
 Italy
-
 Jamaica
-
 Japan
-
 Jordan
-
 Kazakhstan
-
 Kenya
-
 Korea
-
 Kuwait
-
 Kyrgyzstan
-
 Laos
-
 Latvia
-
 Lebanon
-
 Lesotho
-
 Libya
-
 Lithuania
-
 Luxembourg
-
 Madagascar
-
 Malaysia
-
 Malta
-
 Mauritius
-
 Mexico
-
 Moldova
-
 Mongolia
-
 Montenegro
-
 Morocco
-
 Mozambique
-
 Myanmar
-
 Namibia
-
 Nepal
-
 Netherlands
-
 New Zealand
-
 Nigeria
-
 North Macedonia
-
 Norway
-
 Oman
-
 Pakistan
-
 Palestine
-
 Panama
-
 Papua New Guinea
-
 Paraguay
-
 Peru
-
 Philippines
-
 Poland
-
 Portugal
-
 Puerto Rico
-
 Qatar
-
 Reunion
-
 Romania
-
 Rwanda
-
 Saudi Arabia
-
 Serbia
-
 Singapore
-
 Slovakia
-
 Slovenia
-
 Somalia
-
 South Africa
-
 Spain
-
 Sri Lanka
-
 Sweden
-
 Switzerland
-
 Syria
-
 Taiwan
-
 Tajikistan
-
 Tanzania
-
 Thailand
-
 Trinidad and Tobago
-
 Tunisia
-
 Turkey
-
 UAE
-
 Uganda
-
 Ukraine
-
 United Kingdom
-
United States
-
 Uruguay
-
 Uzbekistan
-
 Venezuela
-
 Vietnam
-
 Yemen
-
 Zambia
-
 Zimbabwe
- Forex
- Crypto












