

RKT slides around 2.5% as technical momentum is overshadowed by selling pressure

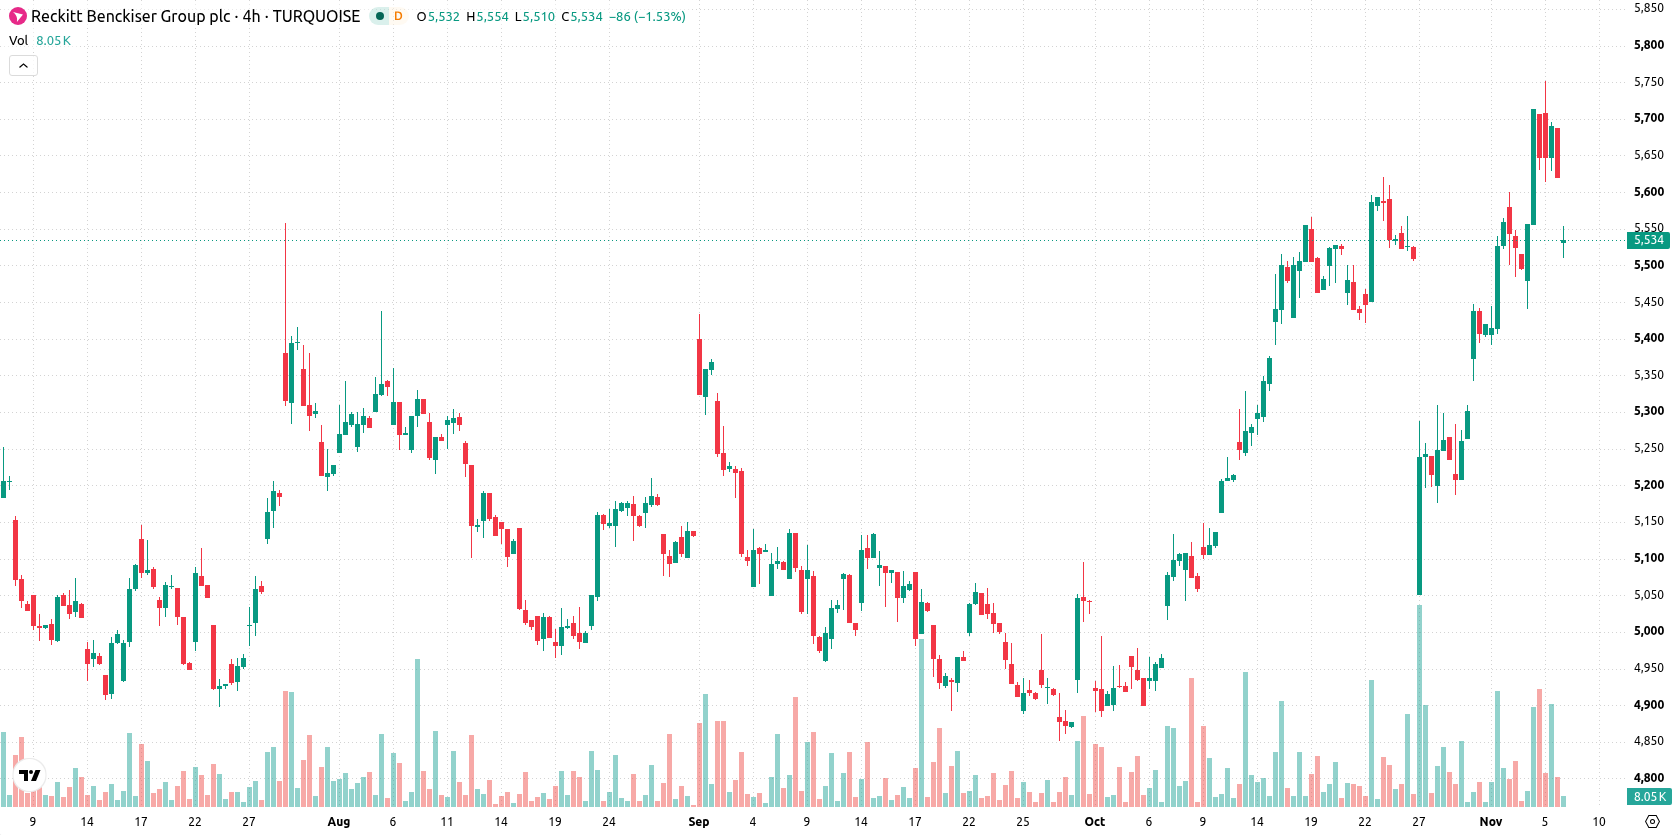
Reckitt Benckiser Group plc (RKT) dropped 2.41% today as renewed technical selling overshadowed the session, leading the price near the day's lows. Short-, medium-, and long-term bullish momentum readings are contradicted by the intraday reversal, which signals pressure against the prevailing trend.
 5590.00
5748.00
Highlights
- Reckitt Benckiser stock remains above key short-, medium- and long-term moving averages, aligning with ongoing bullish price momentum.
- Technical indicators including MACD, ADX, and the Awesome Oscillator show strong bullish strength, with no overbought or oversold signals from RSI-derived measures.
- Shares last traded at GBX5,518, near key support at GBX5,508 and resistance at GBX5,554, with a five-day anticipated range of GBX5,267 to GBX5,769.
Intraday selling pressure persists as bullish signals meet volatility
RKT is trading above its 20-, 50-, and 200-day moving averages (GBX5,433, GBX5,191, and GBX5,210 respectively), indicating bullish momentum across all major timeframes. The closest support is at GBX5,508, with resistance at GBX5,554. Momentum indicators, including MACD and ADX, send strong buy signals reflecting positive trend strength. RSI, Stochastic RSI, and CCI remain neutral, showing no overbought or oversold conditions. Bull/Bear Power signals intraday buyer dominance, and the Awesome Oscillator presents a bullish reading. Price is close to the intraday low after a downside gap, with volatility at 0.84%, highlighting increased selling pressure after the open.
Earlier, analysts noted that Reckitt Benckiser was maintaining technical strength amid positive momentum indicators and successful brand initiatives. The current analysis adds a cautionary note, highlighting that despite bullish signals on higher timeframes, renewed intraday selling pressure has introduced short-term risk with GBX5,508 emerging as a key support level to monitor in the coming sessions.










-
 Afghanistan
-
 Albania
-
 Algeria
-
 Angola
-
 Argentina
-
 Armenia
-
 Australia
-
 Austria
-
 Azerbaijan
-
 Bahamas
-
 Bahrain
-
 Bangladesh
-
 Belarus
-
 Belgium
-
 Bolivia
-
 Botswana
-
 Brazil
-
 Brunei
-
 Bulgaria
-
 Cambodia
-
 Cameroon
-
 Canada
-
 Chile
-
 China
-
 Colombia
-
 Congo
-
 Costa Rica
-
 Cote d'Ivoire
-
 Croatia
-
 Cuba
-
 Cyprus
-
 Czechia
-
 DR Congo
-
 Denmark
-
 Dominican Republic
-
 Ecuador
-
 Egypt
-
 El Salvador
-
 Estonia
-
 Eswatini
-
 Ethiopia
-
 Finland
-
 France
-
 Georgia
-
 Germany
-
 Ghana
-
 Greece
-
 Haiti
-
 Hong Kong
-
 Hungary
-
 India
-
 Indonesia
-
 Iran, Islamic republic
-
 Iraq
-
 Ireland
-
 Israel
-
 Italy
-
 Jamaica
-
 Japan
-
 Jordan
-
 Kazakhstan
-
 Kenya
-
 Korea
-
 Kuwait
-
 Kyrgyzstan
-
 Laos
-
 Latvia
-
 Lebanon
-
 Lesotho
-
 Libya
-
 Lithuania
-
 Luxembourg
-
 Madagascar
-
 Malaysia
-
 Malta
-
 Mauritius
-
 Mexico
-
 Moldova
-
 Mongolia
-
 Montenegro
-
 Morocco
-
 Mozambique
-
 Myanmar
-
 Namibia
-
 Nepal
-
 Netherlands
-
 New Zealand
-
 Nigeria
-
 North Macedonia
-
 Norway
-
 Oman
-
 Pakistan
-
 Palestine
-
 Panama
-
 Papua New Guinea
-
 Paraguay
-
 Peru
-
 Philippines
-
 Poland
-
 Portugal
-
 Puerto Rico
-
 Qatar
-
 Reunion
-
 Romania
-
 Rwanda
-
 Saudi Arabia
-
 Serbia
-
 Singapore
-
 Slovakia
-
 Slovenia
-
 Somalia
-
 South Africa
-
 Spain
-
 Sri Lanka
-
 Sweden
-
 Switzerland
-
 Syria
-
 Taiwan
-
 Tajikistan
-
 Tanzania
-
 Thailand
-
 Trinidad and Tobago
-
 Tunisia
-
 Turkey
-
 UAE
-
 Uganda
-
 Ukraine
-
 United Kingdom
-
United States
-
 Uruguay
-
 Uzbekistan
-
 Venezuela
-
 Vietnam
-
 Yemen
-
 Zambia
-
 Zimbabwe
- Forex
- Crypto












