

What's behind NXP Semiconductors's latest 3.5% stock surge?

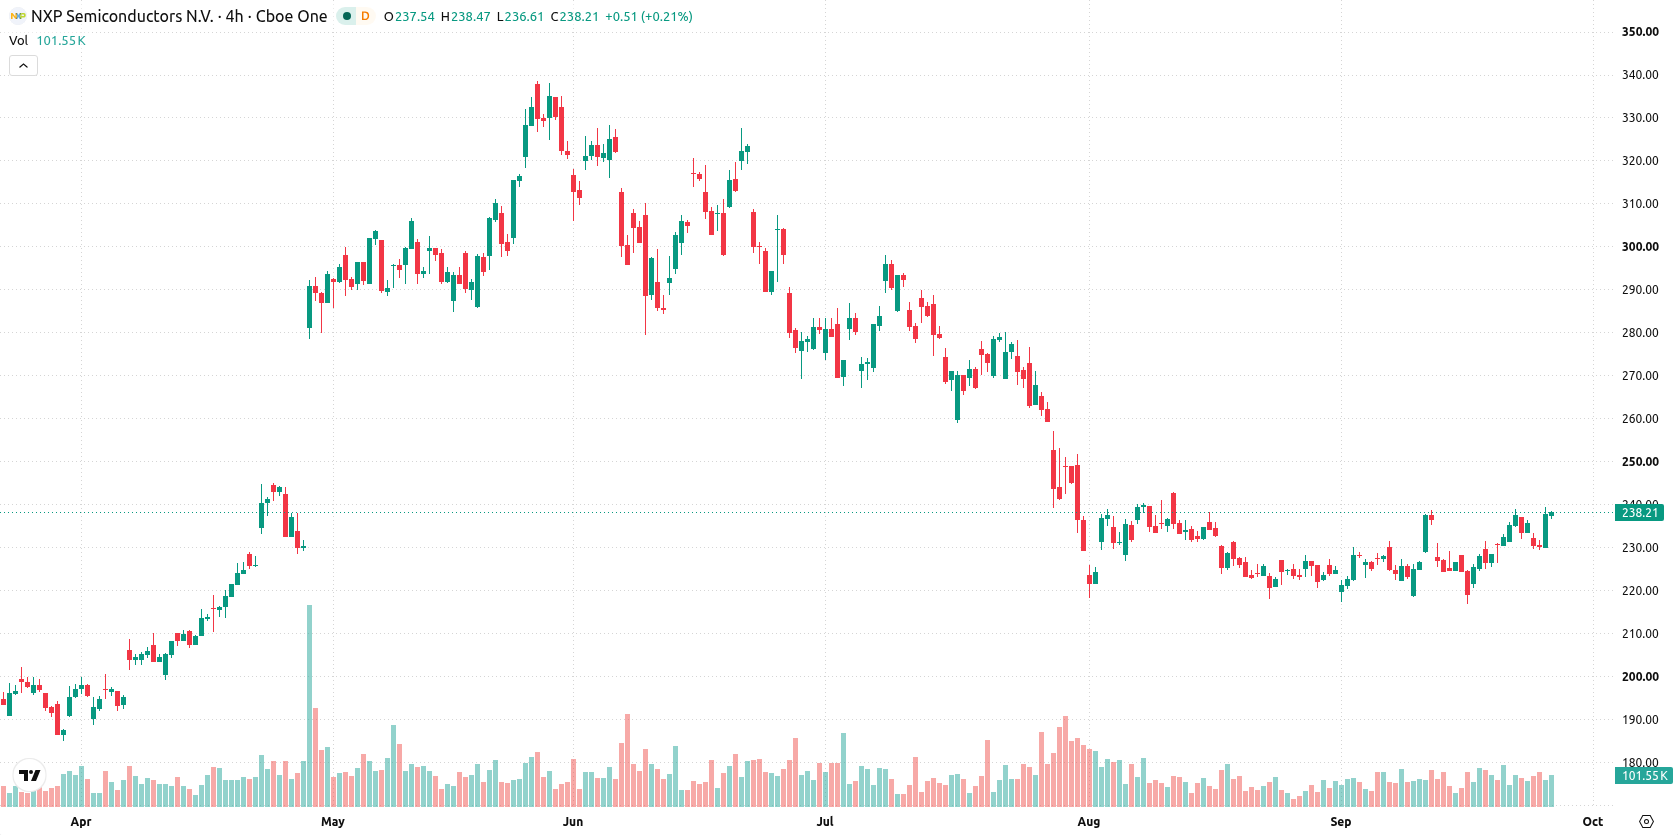
NXP Semiconductors NV (NXPI) climbed 3.51% as strong late-session momentum and short-term technical strength drove buyers into the stock. However, the advance looks limited, with price action still capped below the 200-day moving average and mixed signals from key momentum indicators.
 264.85
266.64
Highlights
- Shares of NXP Semiconductors surged 3.51% in the latest session, closing near the daily high with intraday volatility at 3.93%.
- Trading above short- and medium-term moving averages but below the long-term average, the stock faces resistance at $238.83 and support at $236.69.
- Momentum signals are mixed with most indicators forecasting a short-term sell bias and downside risk toward $232.04 over the next five sessions.
Short-term gains constrained by long-term resistance and mixed momentum
NXPI is trading above the 20-day ($227.46) and 50-day ($236.69) moving averages, but remains below the 200-day ($245.44), indicating near-term and medium-term technical strength with longer-term resistance intact. Key resistance emerges at $238.83, with immediate support at the 50-day moving average of $236.69. The moving average profile remains bearish over the long run as the 50-day continues to lag the 200-day. Momentum signals are mixed: MACD and ADX reflect selling pressure, while RSI, Stochastic RSI, and MACD indicate a short-term bias toward selling. The CCI suggests potential buying interest, and BBP shows intraday buyer dominance but highlights an overbought condition. The Awesome Oscillator remains neutral at current levels.
Earlier, analysts noted that NXP Semiconductors faced sustained bearish pressure, with limited potential for a sustained rebound. The current technical picture adds nuance by highlighting near-term strength within a longer-term downtrend, making $238.83 a pivotal resistance level traders should monitor for confirmation of either a breakout or renewed downside risk.






Latest NXP Semiconductors News




-
 Afghanistan
-
 Albania
-
 Algeria
-
 Angola
-
 Argentina
-
 Armenia
-
 Australia
-
 Austria
-
 Azerbaijan
-
 Bahamas
-
 Bahrain
-
 Bangladesh
-
 Belarus
-
 Belgium
-
 Bolivia
-
 Botswana
-
 Brazil
-
 Brunei
-
 Bulgaria
-
 Cambodia
-
 Cameroon
-
 Canada
-
 Chile
-
 China
-
 Colombia
-
 Congo
-
 Costa Rica
-
 Cote d'Ivoire
-
 Croatia
-
 Cuba
-
 Cyprus
-
 Czechia
-
 DR Congo
-
 Denmark
-
 Dominican Republic
-
 Ecuador
-
 Egypt
-
 El Salvador
-
 Estonia
-
 Eswatini
-
 Ethiopia
-
 Finland
-
 France
-
 Georgia
-
 Germany
-
 Ghana
-
 Greece
-
 Haiti
-
 Hong Kong
-
 Hungary
-
 India
-
 Indonesia
-
 Iran, Islamic republic
-
 Iraq
-
 Ireland
-
 Israel
-
 Italy
-
 Jamaica
-
 Japan
-
 Jordan
-
 Kazakhstan
-
 Kenya
-
 Korea
-
 Kuwait
-
 Kyrgyzstan
-
 Laos
-
 Latvia
-
 Lebanon
-
 Lesotho
-
 Libya
-
 Lithuania
-
 Luxembourg
-
 Madagascar
-
 Malaysia
-
 Malta
-
 Mauritius
-
 Mexico
-
 Moldova
-
 Mongolia
-
 Montenegro
-
 Morocco
-
 Mozambique
-
 Myanmar
-
 Namibia
-
 Nepal
-
 Netherlands
-
 New Zealand
-
 Nigeria
-
 North Macedonia
-
 Norway
-
 Oman
-
 Pakistan
-
 Palestine
-
 Panama
-
 Papua New Guinea
-
 Paraguay
-
 Peru
-
 Philippines
-
 Poland
-
 Portugal
-
 Puerto Rico
-
 Qatar
-
 Reunion
-
 Romania
-
 Rwanda
-
 Saudi Arabia
-
 Serbia
-
 Singapore
-
 Slovakia
-
 Slovenia
-
 Somalia
-
 South Africa
-
 Spain
-
 Sri Lanka
-
 Sweden
-
 Switzerland
-
 Syria
-
 Taiwan
-
 Tajikistan
-
 Tanzania
-
 Thailand
-
 Trinidad and Tobago
-
 Tunisia
-
 Turkey
-
 UAE
-
 Uganda
-
 Ukraine
-
 United Kingdom
-
United States
-
 Uruguay
-
 Uzbekistan
-
 Venezuela
-
 Vietnam
-
 Yemen
-
 Zambia
-
 Zimbabwe
- Forex
- Crypto












