

HIMS consolidates near $29.56 resistance as weak momentum persists

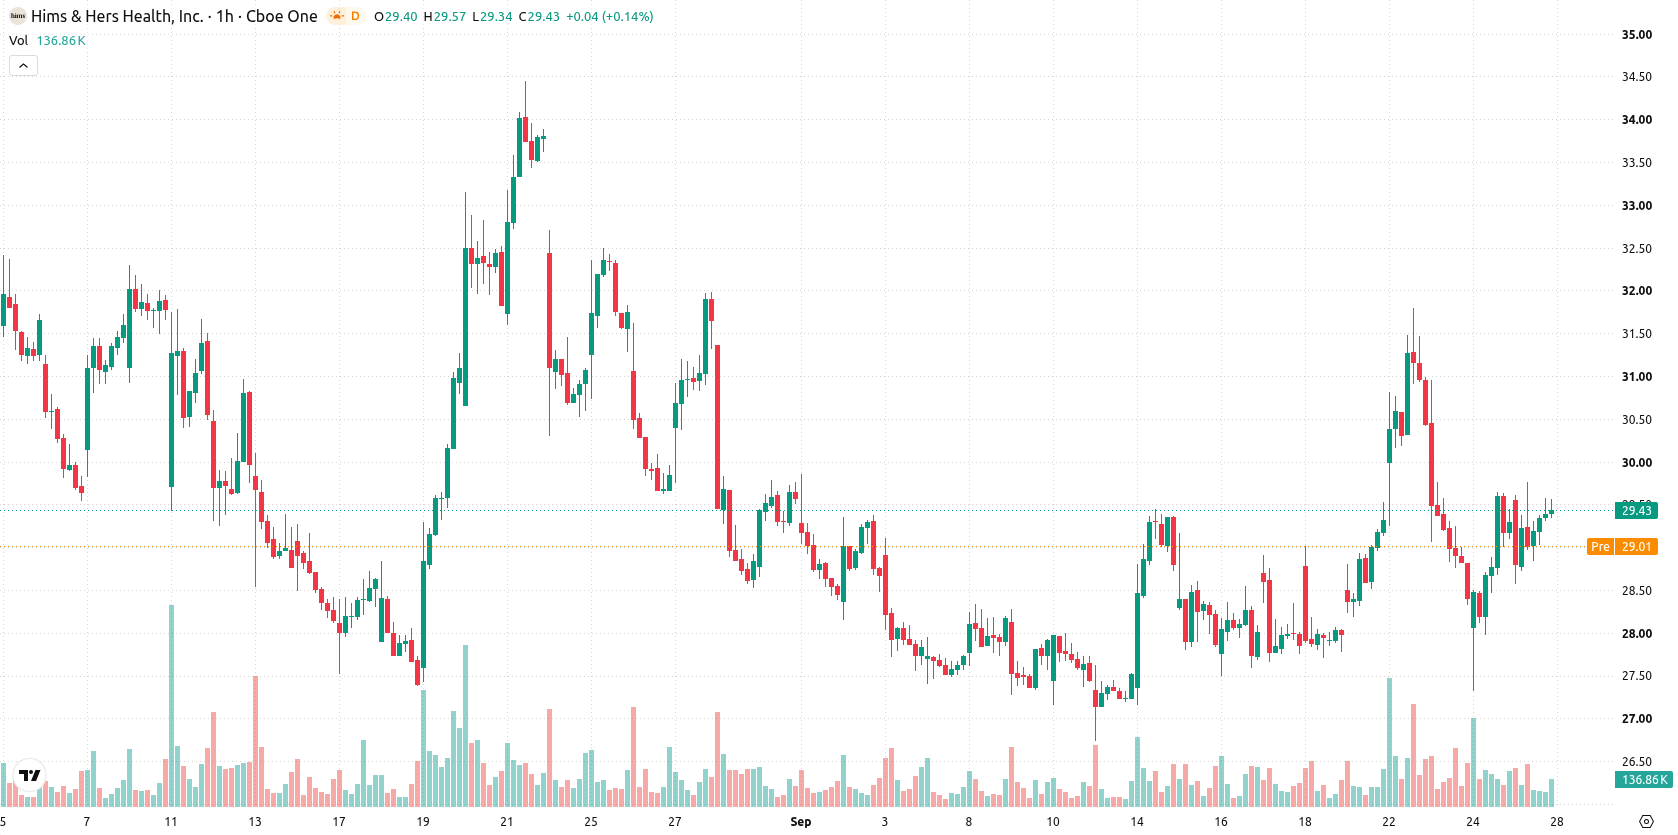
Hims & Hers Health Inc (HIMS) stock is trading at $29.42 today with a modest gain and remains above its key moving averages.
 20.14
25.62
Highlights
- Hims & Hers Health faces a securities fraud class action lawsuit alleging unauthorized data sharing and improper billing practices.
- Investors may seek lead plaintiff status in the lawsuit until November 2, 2026, introducing ongoing litigation risk and possible regulatory scrutiny.
- HIMS/USD shows a bullish technical setup with high probability of trading in the $27.45 to $31.39 range over the next 2 to 3 days, though short-term indicators warn of overbought conditions.
Litigation risk rises as investors respond to lawsuit deadline
Ongoing legal developments are shaping the backdrop for Hims & Hers Health, as investors have until November 2, 2026, to seek lead plaintiff status in a securities fraud class action lawsuit, according to Financialcontent. The suit alleges the company shared consumer health information with third-party advertising platforms and charged customers for prescriptions before a medical provider consultation, introducing potential regulatory scrutiny and legal costs. This heightened litigation risk may weigh on market sentiment and leads to increased attention from stakeholders.
Mixed technical momentum amid volatility and key resistance tests
On the hourly chart, the price is above the MA-20 at $29.01 and MA-50 at $28.93, while on the daily chart, it remains above the long-term MA-200 at $27.76. The Ichimoku Kijun is situated at $29.56, acting as immediate resistance. Today’s trading opened with a gap of 0.28, with the price advancing near the session high amid elevated volatility. Among momentum signals, MACD points to a Buy and RSI and CCI are in Buy territory, while Bull/Bear Power indicates ongoing buyer dominance. However, the Stochastic RSI is overbought, the ADX is neutral, and the Awesome Oscillator offers a neutral signal, highlighting mixed momentum and some caution for short-term trend continuation.
Upside favored as volatility range defines short-term outlook
Looking ahead over the next 2 to 3 trading days, HIMS is expected to trade within a broad volatility band between $27.45 and $31.39. The probability of further upside is seen as very high, with a lower likelihood of a downward move. In the base case, the price may consolidate in this defined range; a clear breakout above immediate resistance could lead toward the upper boundary, while downside risk remains limited unless support is breached.
Earlier, analysts noted that Hims & Hers Health was navigating heightened regulatory and litigation risks, leading to a cautious technical outlook and expectations of continued price consolidation. The latest developments reinforce these themes, but with momentum signals turning increasingly positive and legal deadlines approaching, traders should closely observe price action around the Ichimoku Kijun at $29.56 for signs of a decisive breakout or renewed pullback.






Latest Hims & Hers News





-
 Afghanistan
-
 Albania
-
 Algeria
-
 Angola
-
 Argentina
-
 Armenia
-
 Australia
-
 Austria
-
 Azerbaijan
-
 Bahamas
-
 Bahrain
-
 Bangladesh
-
 Belarus
-
 Belgium
-
 Bolivia
-
 Botswana
-
 Brazil
-
 Brunei
-
 Bulgaria
-
 Cambodia
-
 Cameroon
-
 Canada
-
 Chile
-
 China
-
 Colombia
-
 Congo
-
 Costa Rica
-
 Cote d'Ivoire
-
 Croatia
-
 Cuba
-
 Cyprus
-
 Czechia
-
 DR Congo
-
 Denmark
-
 Dominican Republic
-
 Ecuador
-
 Egypt
-
 El Salvador
-
 Estonia
-
 Eswatini
-
 Ethiopia
-
 Finland
-
 France
-
 Georgia
-
 Germany
-
 Ghana
-
 Greece
-
 Haiti
-
 Hong Kong
-
 Hungary
-
 India
-
 Indonesia
-
 Iran, Islamic republic
-
 Iraq
-
 Ireland
-
 Israel
-
 Italy
-
 Jamaica
-
 Japan
-
 Jordan
-
 Kazakhstan
-
 Kenya
-
 Korea
-
 Kuwait
-
 Kyrgyzstan
-
 Laos
-
 Latvia
-
 Lebanon
-
 Lesotho
-
 Libya
-
 Lithuania
-
 Luxembourg
-
 Madagascar
-
 Malaysia
-
 Malta
-
 Mauritius
-
 Mexico
-
 Moldova
-
 Mongolia
-
 Montenegro
-
 Morocco
-
 Mozambique
-
 Myanmar
-
 Namibia
-
 Nepal
-
 Netherlands
-
 New Zealand
-
 Nigeria
-
 North Macedonia
-
 Norway
-
 Oman
-
 Pakistan
-
 Palestine
-
 Panama
-
 Papua New Guinea
-
 Paraguay
-
 Peru
-
 Philippines
-
 Poland
-
 Portugal
-
 Puerto Rico
-
 Qatar
-
 Reunion
-
 Romania
-
 Rwanda
-
 Saudi Arabia
-
 Serbia
-
 Singapore
-
 Slovakia
-
 Slovenia
-
 Somalia
-
 South Africa
-
 Spain
-
 Sri Lanka
-
 Sweden
-
 Switzerland
-
 Syria
-
 Taiwan
-
 Tajikistan
-
 Tanzania
-
 Thailand
-
 Trinidad and Tobago
-
 Tunisia
-
 Turkey
-
 UAE
-
 Uganda
-
 Ukraine
-
 United Kingdom
-
United States
-
 Uruguay
-
 Uzbekistan
-
 Venezuela
-
 Vietnam
-
 Yemen
-
 Zambia
-
 Zimbabwe
- Forex
- Crypto












