

ARM slides around 5.5% as technical indicators point to overbought conditions despite bullish trends

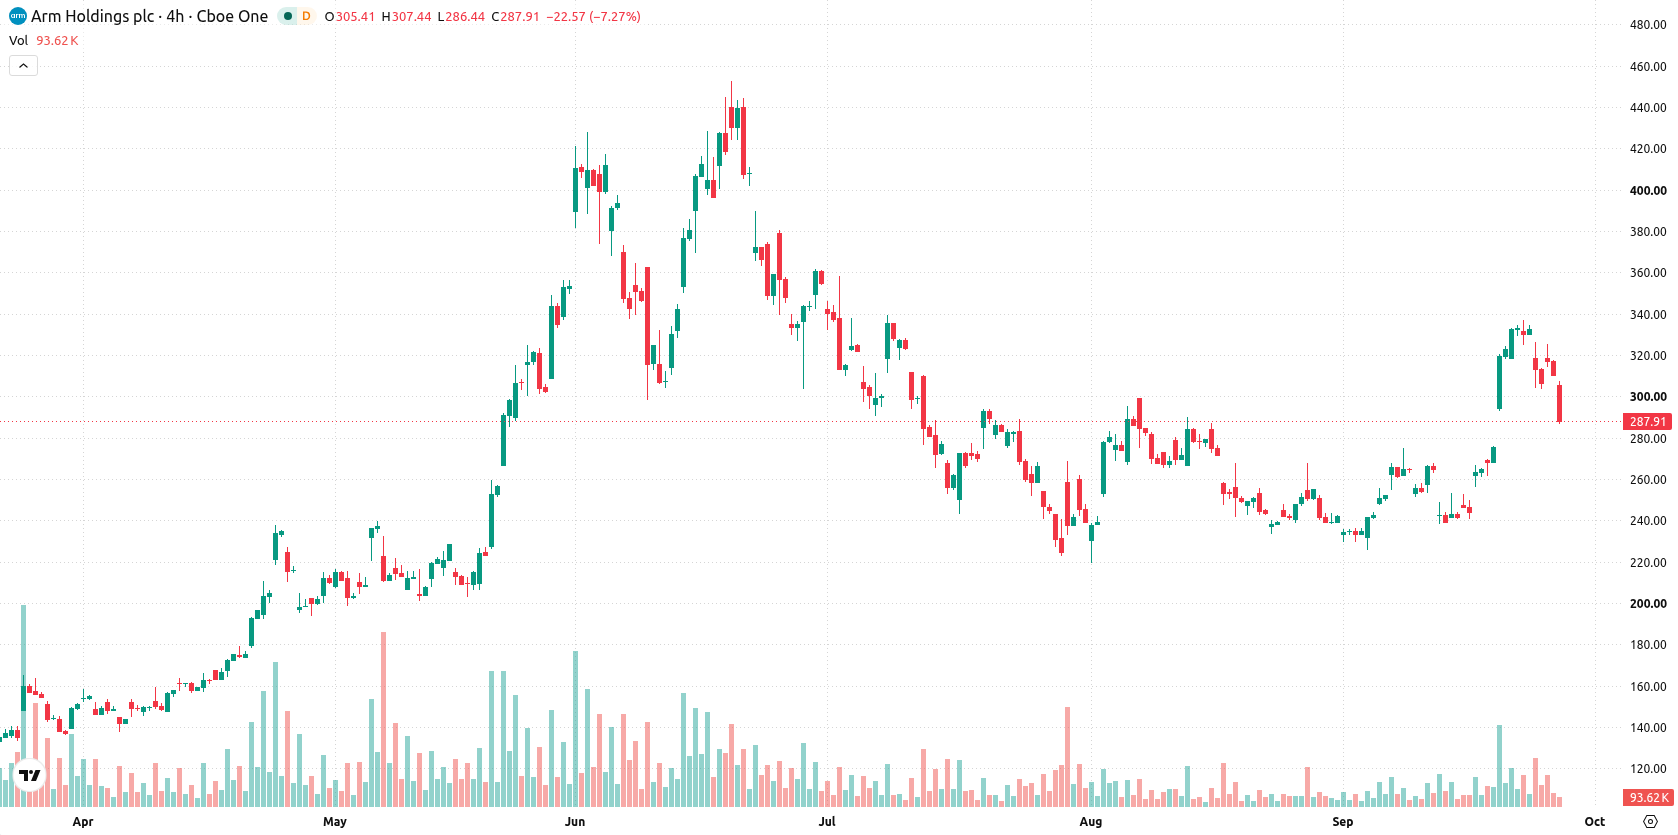
Arm Holdings (ARM) fell 5.41% after opening with a downside gap, as recent gains following strong quarterly results faded from focus. The move is further supported by mixed technical momentum, with the stock still trading above major moving averages but showing signs of intraday overbought conditions and diverging oscillators.
 170.50
191.65
Highlights
- Arm Holdings reported fiscal Q1 revenue growth of 22.4%, supporting its valuation of $331.4 billion.
- The company’s valuation surpassed the consensus target of $305.72 billion as market attention focused on operating results.
- Arm Holdings stock trades above key moving averages but shows mixed momentum indicators, with a projected five-day range of $278.44 to $311.75.
Valuation surpasses targets amid revenue growth but selling pressure persists
Arm Holdings reported a 22.4% increase in fiscal Q1 revenue. The company's valuation reached $331.4 billion, exceeding the consensus target of $305.72 billion. These developments were accompanied by renewed attention to its operating results, though price action has remained under broader selling pressure.
Overbought signals dominate as technical boundaries diverge from bullish trend
Arm is currently trading above its 20-day, 50-day, and 200-day moving averages ($267.86, $264.25, and $211.81), indicating short-, medium-, and long-term bullish momentum. The next key levels are near-term support at $280.65 (Ichimoku Kijun) and resistance near the week’s low at $304.52. Momentum signals are mixed: the MACD is bullish, but the ADX reads as neutral. The RSI at 61.31 suggests mild buying pressure, while the CCI and Bull/Bear Power both point to overbought conditions, indicating buyers currently dominate intraday moves. The Awesome Oscillator remains positive, affirming ongoing strength. The stock is down $16.83 or 5.41% on the day after opening with a downside gap (down about 1.63%), trading near the session’s low with intraday volatility at a subdued 0.22%. This combination of soft price action after the open and overbought momentum suggests potential for further consolidation, with intraday dynamics and oscillators showing a divergence versus the recent upward trend.
Earlier, analysts noted that Arm’s technical outlook was marked by conflicting signals, with short-term uncertainty balanced by a broadly constructive trend. The latest data reinforce this mixed technical setup, and traders should monitor support at $280.65 and resistance at $304.52 as the boundaries for potential near-term moves.










-
 Afghanistan
-
 Albania
-
 Algeria
-
 Angola
-
 Argentina
-
 Armenia
-
 Australia
-
 Austria
-
 Azerbaijan
-
 Bahamas
-
 Bahrain
-
 Bangladesh
-
 Belarus
-
 Belgium
-
 Bolivia
-
 Botswana
-
 Brazil
-
 Brunei
-
 Bulgaria
-
 Cambodia
-
 Cameroon
-
 Canada
-
 Chile
-
 China
-
 Colombia
-
 Congo
-
 Costa Rica
-
 Cote d'Ivoire
-
 Croatia
-
 Cuba
-
 Cyprus
-
 Czechia
-
 DR Congo
-
 Denmark
-
 Dominican Republic
-
 Ecuador
-
 Egypt
-
 El Salvador
-
 Estonia
-
 Eswatini
-
 Ethiopia
-
 Finland
-
 France
-
 Georgia
-
 Germany
-
 Ghana
-
 Greece
-
 Haiti
-
 Hong Kong
-
 Hungary
-
 India
-
 Indonesia
-
 Iran, Islamic republic
-
 Iraq
-
 Ireland
-
 Israel
-
 Italy
-
 Jamaica
-
 Japan
-
 Jordan
-
 Kazakhstan
-
 Kenya
-
 Korea
-
 Kuwait
-
 Kyrgyzstan
-
 Laos
-
 Latvia
-
 Lebanon
-
 Lesotho
-
 Libya
-
 Lithuania
-
 Luxembourg
-
 Madagascar
-
 Malaysia
-
 Malta
-
 Mauritius
-
 Mexico
-
 Moldova
-
 Mongolia
-
 Montenegro
-
 Morocco
-
 Mozambique
-
 Myanmar
-
 Namibia
-
 Nepal
-
 Netherlands
-
 New Zealand
-
 Nigeria
-
 North Macedonia
-
 Norway
-
 Oman
-
 Pakistan
-
 Palestine
-
 Panama
-
 Papua New Guinea
-
 Paraguay
-
 Peru
-
 Philippines
-
 Poland
-
 Portugal
-
 Puerto Rico
-
 Qatar
-
 Reunion
-
 Romania
-
 Rwanda
-
 Saudi Arabia
-
 Serbia
-
 Singapore
-
 Slovakia
-
 Slovenia
-
 Somalia
-
 South Africa
-
 Spain
-
 Sri Lanka
-
 Sweden
-
 Switzerland
-
 Syria
-
 Taiwan
-
 Tajikistan
-
 Tanzania
-
 Thailand
-
 Trinidad and Tobago
-
 Tunisia
-
 Turkey
-
 UAE
-
 Uganda
-
 Ukraine
-
 United Kingdom
-
United States
-
 Uruguay
-
 Uzbekistan
-
 Venezuela
-
 Vietnam
-
 Yemen
-
 Zambia
-
 Zimbabwe
- Forex
- Crypto












