

Visa stock remains capped by Ichimoku Kijun at $372.65 amid uncertain technical direction: weekly analysis

Shares of Visa Inc. (V) are trading near $369 as the stock stalls just below key resistance, with momentum indicators pointing in opposite directions. Mixed signals on the daily chart reflect ongoing uncertainty, setting up a consolidation phase heading into the next week.
 411.88
Highlights
- Shares of Visa have edged up by $1.51 over the last seven days to $368.76, remaining near the 50-day moving average.
- The stock is consolidating with flat price action and rangebound movement as volatility stays constrained at 3.25% for the week.
- Technical indicators show mixed momentum with bearish bias, forecasting a near-term range of $362.49 to $373.99 and resistance at $371.37.
Litigation escrow deposit and robust earnings drive positive sentiment this week
Visa authorized a $405 million deposit into its U.S. litigation escrow account on September 18, 2026, under its retrospective responsibility plan, as cited by Yahoo Finance and Seeking Alpha. This strategic move shields Class A shareholders from legacy litigation liabilities and mimics the accretive effects of a buyback. Recent quarterly results highlighted solid revenue growth, substantial returns to shareholders, and ongoing investment in AI and security assets like BioCatch.
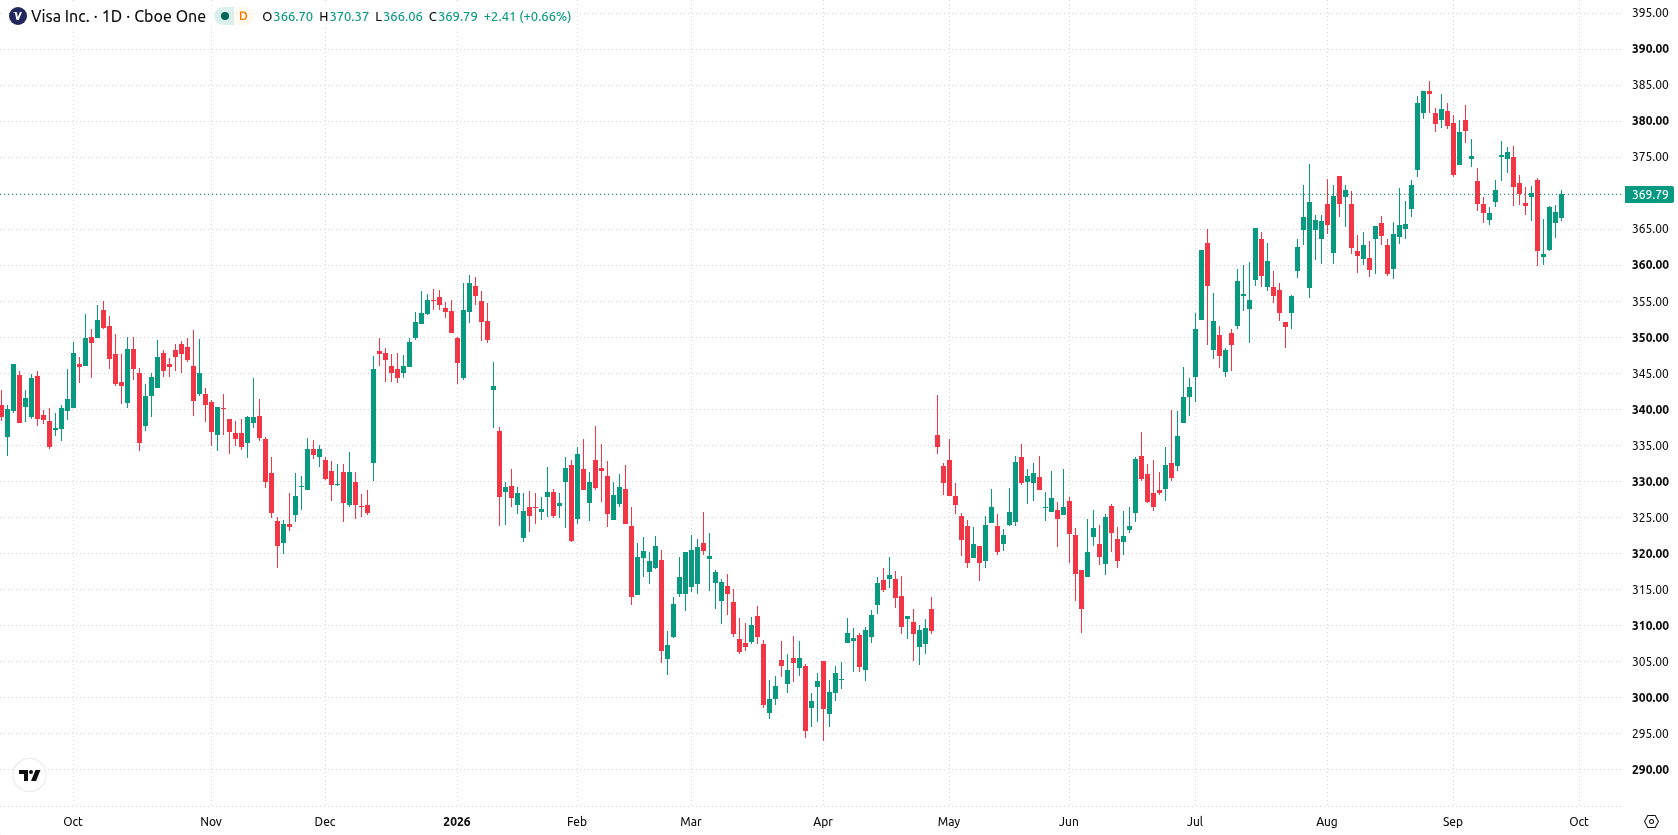
Bearish momentum grows as volatility narrows and consolidation holds
The daily chart signals a flat trend with a contained move within a narrow range, aligning with the 3.25% volatility seen this week. MACD and the Awesome Oscillator both tilt bearish, while the RSI remains in neutral territory at 47.92. Immediate support sits at $367.96 from the MA-50, while resistance is found at $371.37 and reinforced by the Ichimoku Kijun at $372.65. Mixed momentum and opposing signals suggest the stock is consolidating near its mid-term pivot.
Resistance breakout risk rises with bias for continued range trading next week
Over the next five trading days, Visa shares are expected to fluctuate between $362.49 and $373.99. The probabilities stand at 47% for an increase and 53% for a decrease. The base case is for price action to stay capped between $367.96 support and $371.37 resistance. A sustained move above the resistance at $371.37 could open a test of the upper boundary at $373.99. Alternatively, a break below $367.96 may see price drift toward $362.49.
Earlier, analysts noted that Visa's strategic embrace of stablecoin technology and partnerships with established banking institutions have positioned it at the forefront of payments innovation. The current consolidation below resistance highlights a pivotal technical juncture, making a decisive break above $371.37 or below $367.96 the key trigger for the next directional move.











-
 Afghanistan
-
 Albania
-
 Algeria
-
 Angola
-
 Argentina
-
 Armenia
-
 Australia
-
 Austria
-
 Azerbaijan
-
 Bahamas
-
 Bahrain
-
 Bangladesh
-
 Belarus
-
 Belgium
-
 Bolivia
-
 Botswana
-
 Brazil
-
 Brunei
-
 Bulgaria
-
 Cambodia
-
 Cameroon
-
 Canada
-
 Chile
-
 China
-
 Colombia
-
 Congo
-
 Costa Rica
-
 Cote d'Ivoire
-
 Croatia
-
 Cuba
-
 Cyprus
-
 Czechia
-
 DR Congo
-
 Denmark
-
 Dominican Republic
-
 Ecuador
-
 Egypt
-
 El Salvador
-
 Estonia
-
 Eswatini
-
 Ethiopia
-
 Finland
-
 France
-
 Georgia
-
 Germany
-
 Ghana
-
 Greece
-
 Haiti
-
 Hong Kong
-
 Hungary
-
 India
-
 Indonesia
-
 Iran, Islamic republic
-
 Iraq
-
 Ireland
-
 Israel
-
 Italy
-
 Jamaica
-
 Japan
-
 Jordan
-
 Kazakhstan
-
 Kenya
-
 Korea
-
 Kuwait
-
 Kyrgyzstan
-
 Laos
-
 Latvia
-
 Lebanon
-
 Lesotho
-
 Libya
-
 Lithuania
-
 Luxembourg
-
 Madagascar
-
 Malaysia
-
 Malta
-
 Mauritius
-
 Mexico
-
 Moldova
-
 Mongolia
-
 Montenegro
-
 Morocco
-
 Mozambique
-
 Myanmar
-
 Namibia
-
 Nepal
-
 Netherlands
-
 New Zealand
-
 Nigeria
-
 North Macedonia
-
 Norway
-
 Oman
-
 Pakistan
-
 Palestine
-
 Panama
-
 Papua New Guinea
-
 Paraguay
-
 Peru
-
 Philippines
-
 Poland
-
 Portugal
-
 Puerto Rico
-
 Qatar
-
 Reunion
-
 Romania
-
 Rwanda
-
 Saudi Arabia
-
 Serbia
-
 Singapore
-
 Slovakia
-
 Slovenia
-
 Somalia
-
 South Africa
-
 Spain
-
 Sri Lanka
-
 Sweden
-
 Switzerland
-
 Syria
-
 Taiwan
-
 Tajikistan
-
 Tanzania
-
 Thailand
-
 Trinidad and Tobago
-
 Tunisia
-
 Turkey
-
 UAE
-
 Uganda
-
 Ukraine
-
 United Kingdom
-
United States
-
 Uruguay
-
 Uzbekistan
-
 Venezuela
-
 Vietnam
-
 Yemen
-
 Zambia
-
 Zimbabwe
- Forex
- Crypto












