

What's behind Lucid Group's latest 4.3% stock pullback?

Lucid Group, Inc. (LCID) slid 4.29% following sustained competitive pressures in the luxury EV sector and ongoing concerns over its cash burn and slower path to profitability. The decline is supported by persistent downside technical momentum, with the stock trading below all key moving averages and showing continued weakness across major trend indicators.
 3.11
3.59
Highlights
- Lucid Group maintained its luxury electric vehicle strategy anchored by the Air sedan and Gravity SUV, securing a supply agreement with the Saudi government for up to 100,000 vehicles.
- The company faces rapid cash use and lags peer valuations, with shares under continued broad selling pressure.
- Shares of Lucid Group trade below key moving averages with decisive negative momentum, a bearish structure, and a projected five-day range of $3.73 to $4.10.
Saudi agreement offsets cash burn as valuation lags sector peers
Lucid Group continued to develop its presence in the luxury electric vehicle market with the Air sedan and the recently launched Gravity SUV. The company retained a strategic supply agreement with the Government of Saudi Arabia, which involves a commitment to purchase up to 100,000 vehicles over time. Challenges for Lucid included rapid cash expenditure and remaining valuations below peers, though price action has remained under broader selling pressure.
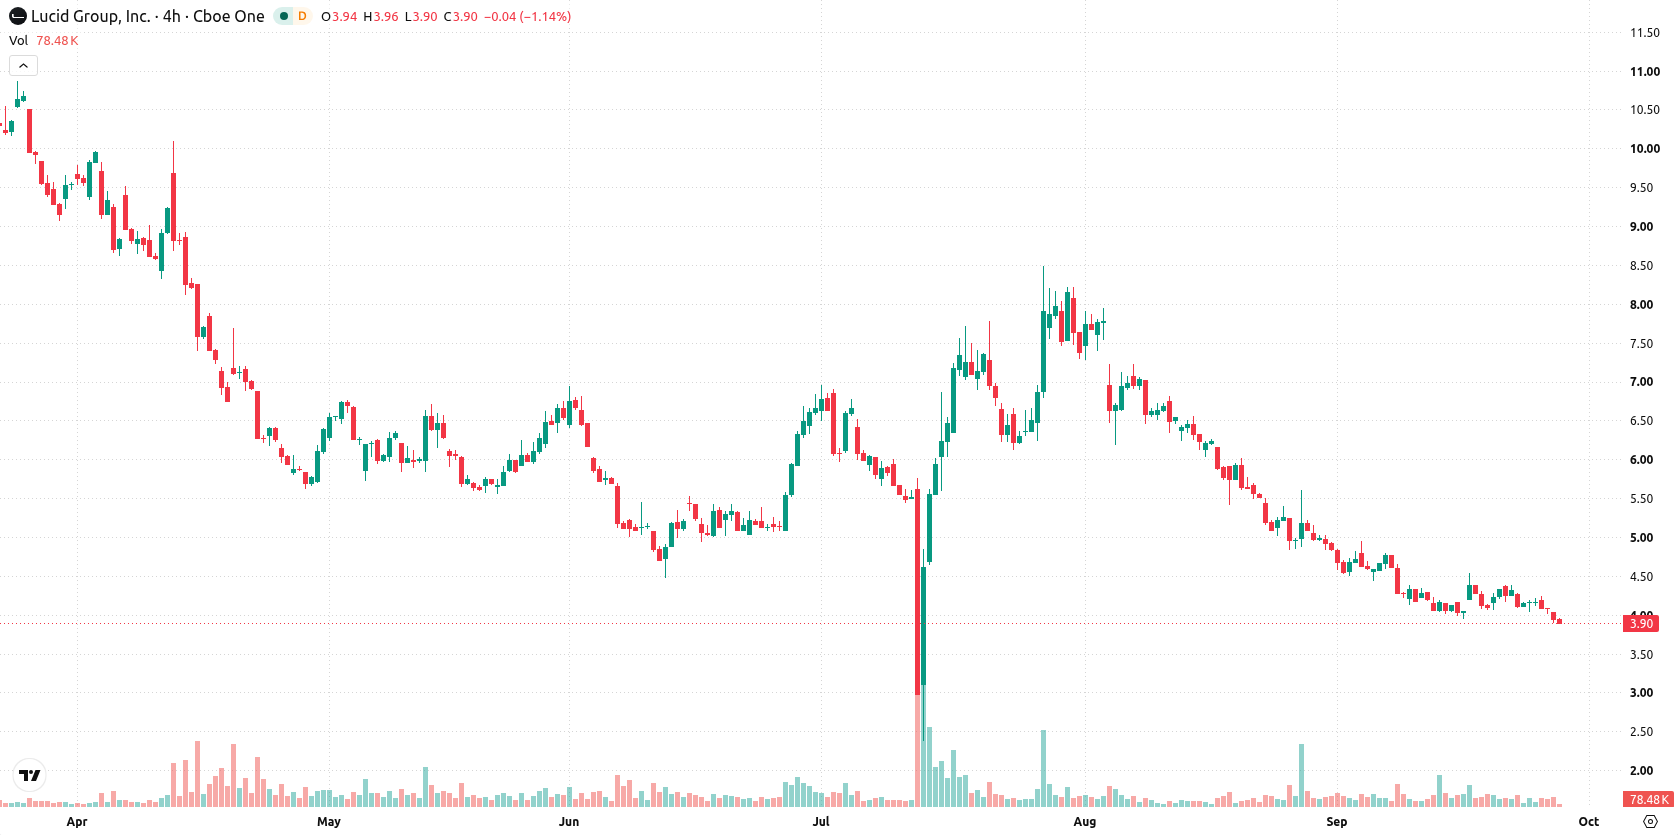
Bearish momentum confirmed as all monitors align beneath support
Lucid Group is trading below its 20-day, 50-day, and 200-day moving averages at $4.37, $5.69, and $7.86 respectively. This alignment confirms sustained downside pressure and a bearish structure across short, medium, and long-term timeframes, with a bearish signal also coming from the MA-50 versus MA-200. The nearest resistance is at $3.93 and the closest support lies at $3.73. Momentum readings are decisively negative. The Moving Average Convergence Divergence (MACD) and Average Directional Index (ADX) both point to further selling pressure. The Relative Strength Index (RSI) is at 34.38 with a “Sell” signal, indicating the stock is approaching but not yet in oversold territory. The Commodity Channel Index (CCI) is also negative at -74.08, reinforcing the bearish tone. Bull/Bear Power (BBP) stands at -0.07, confirming sellers are in control of intraday action. Today, the stock is down to $3.91, declining $0.175 or 4.29%, after a downside gap of about $0.09, or 2.21%, at the open. The price is near the session low and intraday volatility stands at 2.29%. The market has shown clear pressure after the open. Most intraday and trend momentum tools agree on continued selling, with no significant divergence among key oscillators.
Earlier, analysts noted that Lucid Group was experiencing persistent technical weakness and heightened concerns over accelerated cash burn. The current analysis reinforces this view with updated technical signals and recent price action, highlighting $3.73 as a critical level for further downside risk in the days ahead.










-
 Afghanistan
-
 Albania
-
 Algeria
-
 Angola
-
 Argentina
-
 Armenia
-
 Australia
-
 Austria
-
 Azerbaijan
-
 Bahamas
-
 Bahrain
-
 Bangladesh
-
 Belarus
-
 Belgium
-
 Bolivia
-
 Botswana
-
 Brazil
-
 Brunei
-
 Bulgaria
-
 Cambodia
-
 Cameroon
-
 Canada
-
 Chile
-
 China
-
 Colombia
-
 Congo
-
 Costa Rica
-
 Cote d'Ivoire
-
 Croatia
-
 Cuba
-
 Cyprus
-
 Czechia
-
 DR Congo
-
 Denmark
-
 Dominican Republic
-
 Ecuador
-
 Egypt
-
 El Salvador
-
 Estonia
-
 Eswatini
-
 Ethiopia
-
 Finland
-
 France
-
 Georgia
-
 Germany
-
 Ghana
-
 Greece
-
 Haiti
-
 Hong Kong
-
 Hungary
-
 India
-
 Indonesia
-
 Iran, Islamic republic
-
 Iraq
-
 Ireland
-
 Israel
-
 Italy
-
 Jamaica
-
 Japan
-
 Jordan
-
 Kazakhstan
-
 Kenya
-
 Korea
-
 Kuwait
-
 Kyrgyzstan
-
 Laos
-
 Latvia
-
 Lebanon
-
 Lesotho
-
 Libya
-
 Lithuania
-
 Luxembourg
-
 Madagascar
-
 Malaysia
-
 Malta
-
 Mauritius
-
 Mexico
-
 Moldova
-
 Mongolia
-
 Montenegro
-
 Morocco
-
 Mozambique
-
 Myanmar
-
 Namibia
-
 Nepal
-
 Netherlands
-
 New Zealand
-
 Nigeria
-
 North Macedonia
-
 Norway
-
 Oman
-
 Pakistan
-
 Palestine
-
 Panama
-
 Papua New Guinea
-
 Paraguay
-
 Peru
-
 Philippines
-
 Poland
-
 Portugal
-
 Puerto Rico
-
 Qatar
-
 Reunion
-
 Romania
-
 Rwanda
-
 Saudi Arabia
-
 Serbia
-
 Singapore
-
 Slovakia
-
 Slovenia
-
 Somalia
-
 South Africa
-
 Spain
-
 Sri Lanka
-
 Sweden
-
 Switzerland
-
 Syria
-
 Taiwan
-
 Tajikistan
-
 Tanzania
-
 Thailand
-
 Trinidad and Tobago
-
 Tunisia
-
 Turkey
-
 UAE
-
 Uganda
-
 Ukraine
-
 United Kingdom
-
United States
-
 Uruguay
-
 Uzbekistan
-
 Venezuela
-
 Vietnam
-
 Yemen
-
 Zambia
-
 Zimbabwe
- Forex
- Crypto












