


Arm Holdings (ARM) jumped 3.37% after recent volatility, as buyers returned following last week's sharp sector selloff and profit taking. The up move is supported by bullish momentum, with ARM trading above major moving averages and pressing against immediate resistance.
 170.50
191.65
Highlights
- Arm Holdings reported fiscal Q1 revenue up 22.4% year on year and published its 2026 annual report.
- ETF flows showed $26.7 million in Arm shares sold on September 25, 2026, with annual meeting results disclosed.
- Shares of Arm are above key moving averages, trading in a bullish trend with a projected five-day range of $264.58 to $321.18.
Revenue growth and ETF outflows drive post-earnings volatility
Arm Holdings experienced heightened volatility in late September 2026 after a strong rally earlier in the month. The company reported a 22.4% year-on-year increase in fiscal Q1 revenue and published its fiscal 2026 annual report. ETF activity showed $26.7 million in ARM shares were sold on September 25, 2026, and annual meeting results were disclosed.
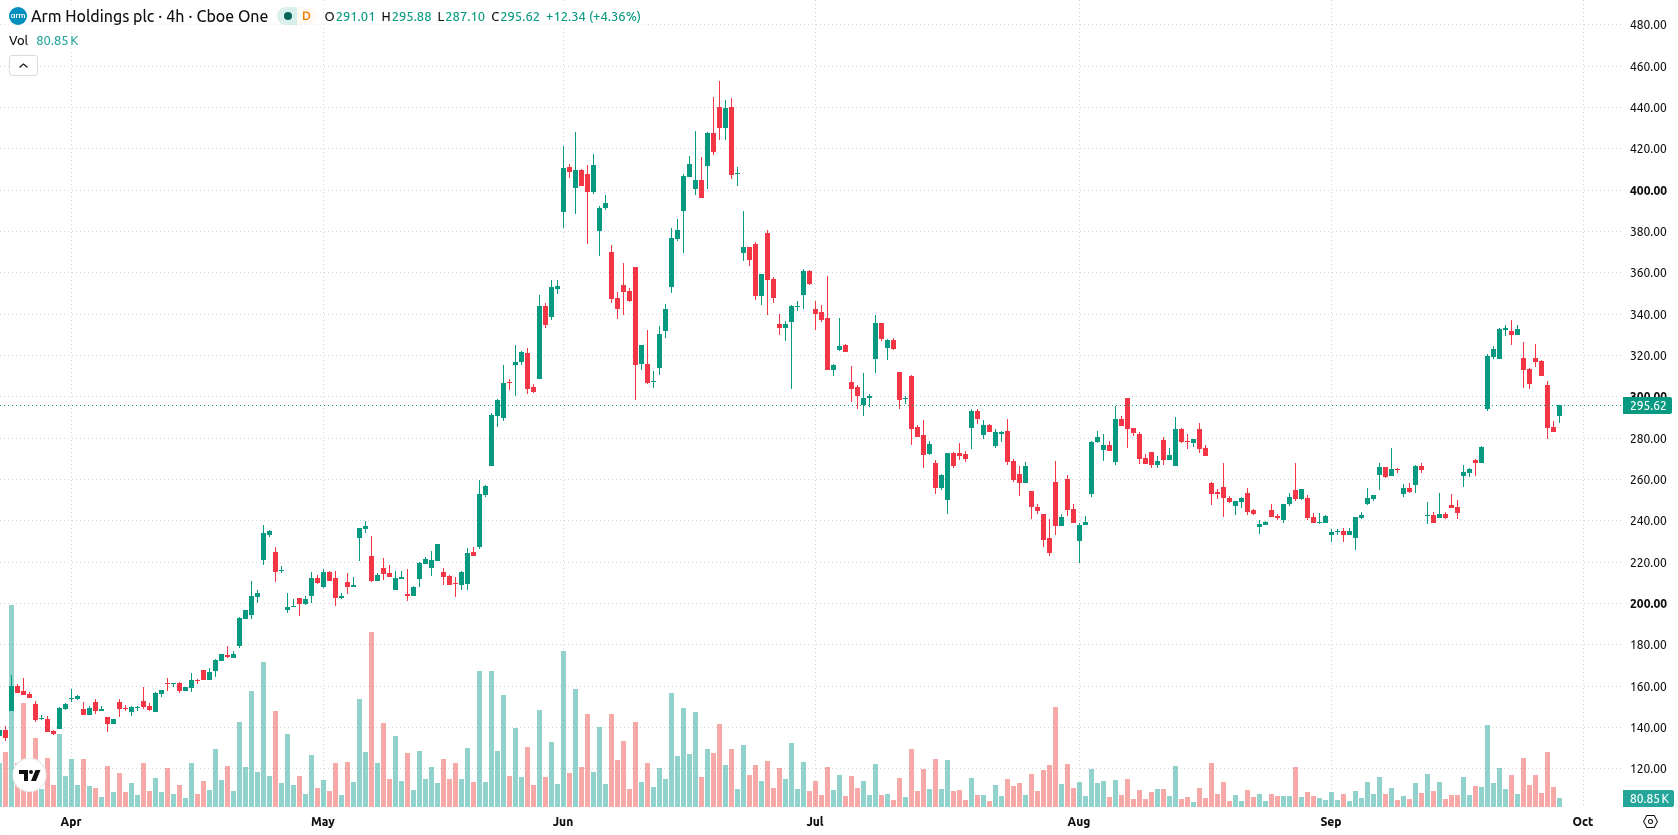
Bullish technical setup as major averages reinforce sustained uptrend
Arm is currently positioned above the 20-day ($270.18), 50-day ($264.62), and 200-day ($212.53) moving averages, which signals bullish momentum across all timeframes. The nearest resistance is at $321.18, with immediate support located at $291.03. The 50-day moving average sitting above the 200-day confirms a positive long-term outlook. On the momentum front, the MACD remains in a buying setup, and the ADX at 15.5 indicates moderate trend strength. RSI at 52.39 and CCI at 49.66 reflect balanced conditions, neither overbought nor oversold. Bull/Bear Power shows buyers dominating intraday momentum and flags a potential overbought state, while the HMA signals some caution. The stock opened with a sizeable upside gap of $7.68 (2.71%) and continues to trade near the session highs, though intraday volatility is contained at 0.75%.
Earlier, analysts noted that Arm faced significant selling pressure and rising liquidity risk, pointing to a critical phase for the stock. The current article marks a notable reversal, with technical signals now supporting a constructive outlook and highlighting $321.18 as the pivotal resistance to watch for any sustained breakout.










-
 Afghanistan
-
 Albania
-
 Algeria
-
 Angola
-
 Argentina
-
 Armenia
-
 Australia
-
 Austria
-
 Azerbaijan
-
 Bahamas
-
 Bahrain
-
 Bangladesh
-
 Belarus
-
 Belgium
-
 Bolivia
-
 Botswana
-
 Brazil
-
 Brunei
-
 Bulgaria
-
 Cambodia
-
 Cameroon
-
 Canada
-
 Chile
-
 China
-
 Colombia
-
 Congo
-
 Costa Rica
-
 Cote d'Ivoire
-
 Croatia
-
 Cuba
-
 Cyprus
-
 Czechia
-
 DR Congo
-
 Denmark
-
 Dominican Republic
-
 Ecuador
-
 Egypt
-
 El Salvador
-
 Estonia
-
 Eswatini
-
 Ethiopia
-
 Finland
-
 France
-
 Georgia
-
 Germany
-
 Ghana
-
 Greece
-
 Haiti
-
 Hong Kong
-
 Hungary
-
 India
-
 Indonesia
-
 Iran, Islamic republic
-
 Iraq
-
 Ireland
-
 Israel
-
 Italy
-
 Jamaica
-
 Japan
-
 Jordan
-
 Kazakhstan
-
 Kenya
-
 Korea
-
 Kuwait
-
 Kyrgyzstan
-
 Laos
-
 Latvia
-
 Lebanon
-
 Lesotho
-
 Libya
-
 Lithuania
-
 Luxembourg
-
 Madagascar
-
 Malaysia
-
 Malta
-
 Mauritius
-
 Mexico
-
 Moldova
-
 Mongolia
-
 Montenegro
-
 Morocco
-
 Mozambique
-
 Myanmar
-
 Namibia
-
 Nepal
-
 Netherlands
-
 New Zealand
-
 Nigeria
-
 North Macedonia
-
 Norway
-
 Oman
-
 Pakistan
-
 Palestine
-
 Panama
-
 Papua New Guinea
-
 Paraguay
-
 Peru
-
 Philippines
-
 Poland
-
 Portugal
-
 Puerto Rico
-
 Qatar
-
 Reunion
-
 Romania
-
 Rwanda
-
 Saudi Arabia
-
 Serbia
-
 Singapore
-
 Slovakia
-
 Slovenia
-
 Somalia
-
 South Africa
-
 Spain
-
 Sri Lanka
-
 Sweden
-
 Switzerland
-
 Syria
-
 Taiwan
-
 Tajikistan
-
 Tanzania
-
 Thailand
-
 Trinidad and Tobago
-
 Tunisia
-
 Turkey
-
 UAE
-
 Uganda
-
 Ukraine
-
 United Kingdom
-
United States
-
 Uruguay
-
 Uzbekistan
-
 Venezuela
-
 Vietnam
-
 Yemen
-
 Zambia
-
 Zimbabwe
- Forex
- Crypto












