

Eli Lilly stock weekly forecast: Price action consolidates as support at $1,177 stays in focus

Shares of Eli Lilly and Company (LLY) are trading near $1,180 as a recovery setup holds, but price action remains stretched heading into the week. Corporate developments remain in focus, with support levels holding but overbought conditions suggesting limited room for further upside for now.
 1299.43
1320.59
Highlights
- Shares of Eli Lilly traded slightly lower over the past week and held at the 50-day moving average at $1,177.
- Technical indicators describe overbought momentum with price consolidating between defined support and resistance levels.
- Eli Lilly shares are forecast to move in a $1,157 to $1,203 range next week with a 70% probability of increasing.
FDA approvals and new initiatives boost sentiment amid acquisition plans
On September 28, 2026, LLY announced the Lilly Change the Course Commitment, a global initiative to expand access to its diabetes and obesity medications in low- and middle-income countries by 2040, according to Eli Lilly’s investor website. Recent FDA approvals for Onswik, a once-weekly basal insulin for adults with type 2 diabetes, and Olumiant for adolescents with severe alopecia areata, as reported by Simply Wall St and 24/7 Wall St, continue to support sentiment. Additionally, LLY received Breakthrough Therapy designation from the FDA for olomorasib in advanced pancreatic cancer, and CEO Dave Ricks signaled plans for larger-scale acquisitions following the Centessa deal, according to Bloomberg and GuruFocus.
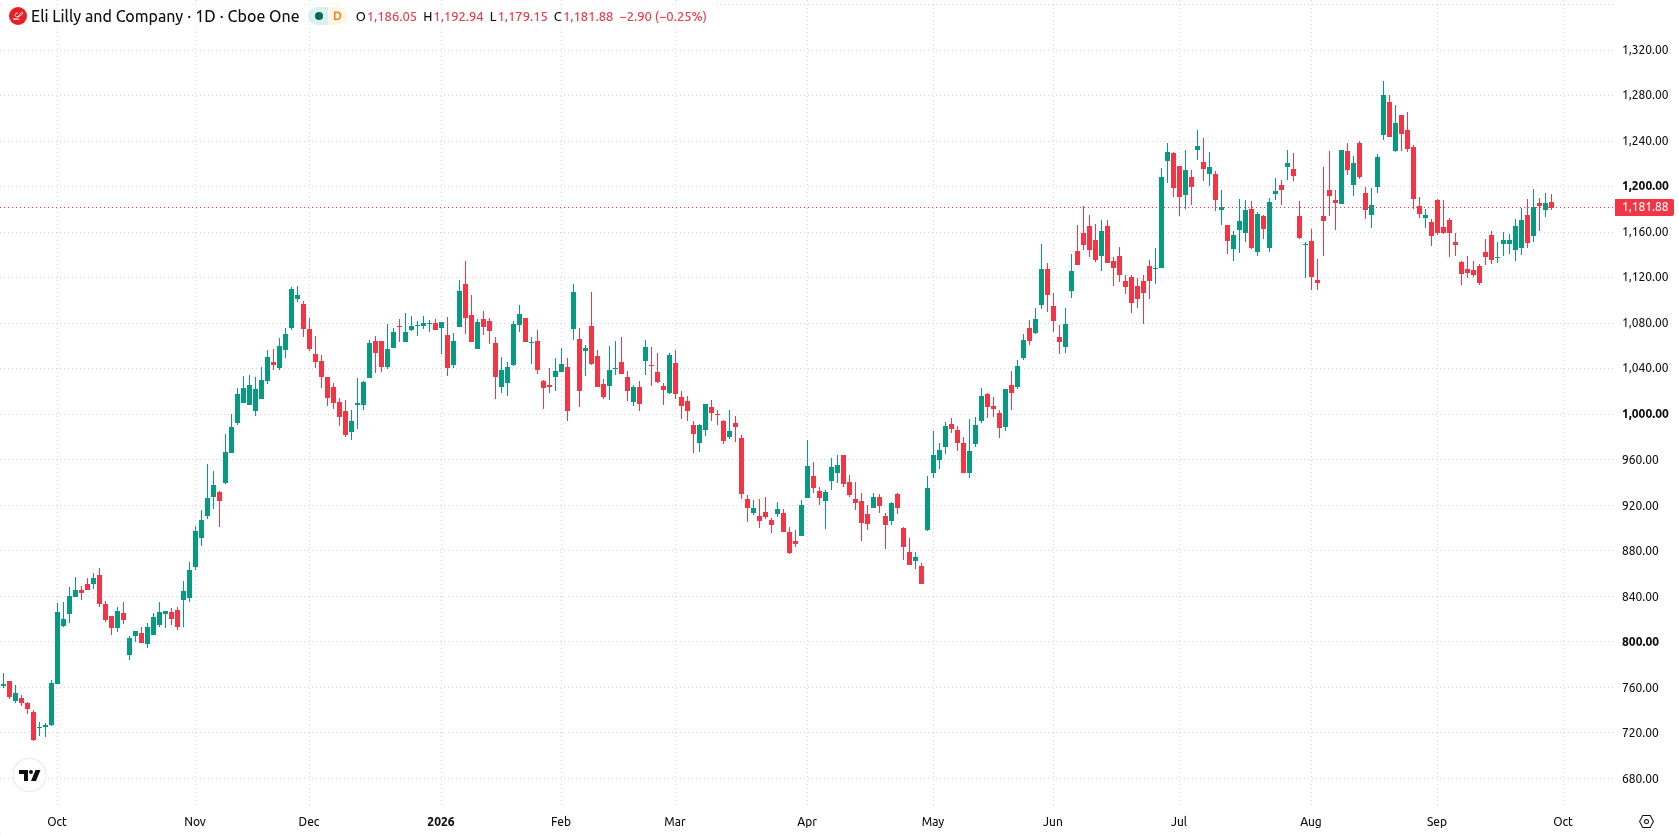
Consolidation narrows as overbought signals cap momentum near resistance
On the daily chart, the technical setup points to consolidation, with price action contained between support and resistance levels while volatility over the past week stands at 4.49%. Both the CCI at 150.04 and Stoch RSI at 100 register as overbought, signaling stretched momentum against a neutral RSI. The immediate setup centers on price holding at support from the 50-day moving average at $1,177 and facing resistance at the Ichimoku Kijun at $1,192. This alignment suggests a contained move within a narrow range, with upside capped by resistance.
Ongoing consolidation likely as range breakout risk rises next week
For the coming trading week, Eli Lilly shares are expected to move within a $1,157 to $1,203 range. There is a 70% probability of an increase and a 30% probability of a decrease. The base case favors ongoing consolidation between support at $1,177 and resistance at $1,192. A clear move above $1,192 would open the way for a test of the upper end of the range, while a drop below $1,177 would point toward further downside, targeting the lower boundary.
Earlier, analysts noted that competitive pressures from Eli Lilly in the obesity drug market, coupled with sector-wide financial shifts, were central to recent market moves. The current technical setup indicates that traders should focus on the prevailing consolidation pattern, with the $1,177 support and $1,192 resistance levels marking key pivots for any potential breakout or reversal in Eli Lilly shares.






Latest Eli Lilly and Company News




-
 Afghanistan
-
 Albania
-
 Algeria
-
 Angola
-
 Argentina
-
 Armenia
-
 Australia
-
 Austria
-
 Azerbaijan
-
 Bahamas
-
 Bahrain
-
 Bangladesh
-
 Belarus
-
 Belgium
-
 Bolivia
-
 Botswana
-
 Brazil
-
 Brunei
-
 Bulgaria
-
 Cambodia
-
 Cameroon
-
 Canada
-
 Chile
-
 China
-
 Colombia
-
 Congo
-
 Costa Rica
-
 Cote d'Ivoire
-
 Croatia
-
 Cuba
-
 Cyprus
-
 Czechia
-
 DR Congo
-
 Denmark
-
 Dominican Republic
-
 Ecuador
-
 Egypt
-
 El Salvador
-
 Estonia
-
 Eswatini
-
 Ethiopia
-
 Finland
-
 France
-
 Georgia
-
 Germany
-
 Ghana
-
 Greece
-
 Haiti
-
 Hong Kong
-
 Hungary
-
 India
-
 Indonesia
-
 Iran, Islamic republic
-
 Iraq
-
 Ireland
-
 Israel
-
 Italy
-
 Jamaica
-
 Japan
-
 Jordan
-
 Kazakhstan
-
 Kenya
-
 Korea
-
 Kuwait
-
 Kyrgyzstan
-
 Laos
-
 Latvia
-
 Lebanon
-
 Lesotho
-
 Libya
-
 Lithuania
-
 Luxembourg
-
 Madagascar
-
 Malaysia
-
 Malta
-
 Mauritius
-
 Mexico
-
 Moldova
-
 Mongolia
-
 Montenegro
-
 Morocco
-
 Mozambique
-
 Myanmar
-
 Namibia
-
 Nepal
-
 Netherlands
-
 New Zealand
-
 Nigeria
-
 North Macedonia
-
 Norway
-
 Oman
-
 Pakistan
-
 Palestine
-
 Panama
-
 Papua New Guinea
-
 Paraguay
-
 Peru
-
 Philippines
-
 Poland
-
 Portugal
-
 Puerto Rico
-
 Qatar
-
 Reunion
-
 Romania
-
 Rwanda
-
 Saudi Arabia
-
 Serbia
-
 Singapore
-
 Slovakia
-
 Slovenia
-
 Somalia
-
 South Africa
-
 Spain
-
 Sri Lanka
-
 Sweden
-
 Switzerland
-
 Syria
-
 Taiwan
-
 Tajikistan
-
 Tanzania
-
 Thailand
-
 Trinidad and Tobago
-
 Tunisia
-
 Turkey
-
 UAE
-
 Uganda
-
 Ukraine
-
 United Kingdom
-
United States
-
 Uruguay
-
 Uzbekistan
-
 Venezuela
-
 Vietnam
-
 Yemen
-
 Zambia
-
 Zimbabwe
- Forex
- Crypto












