

Home Depot shares weekly forecast: Negative sentiment dominates as price anchors at the bottom of the range

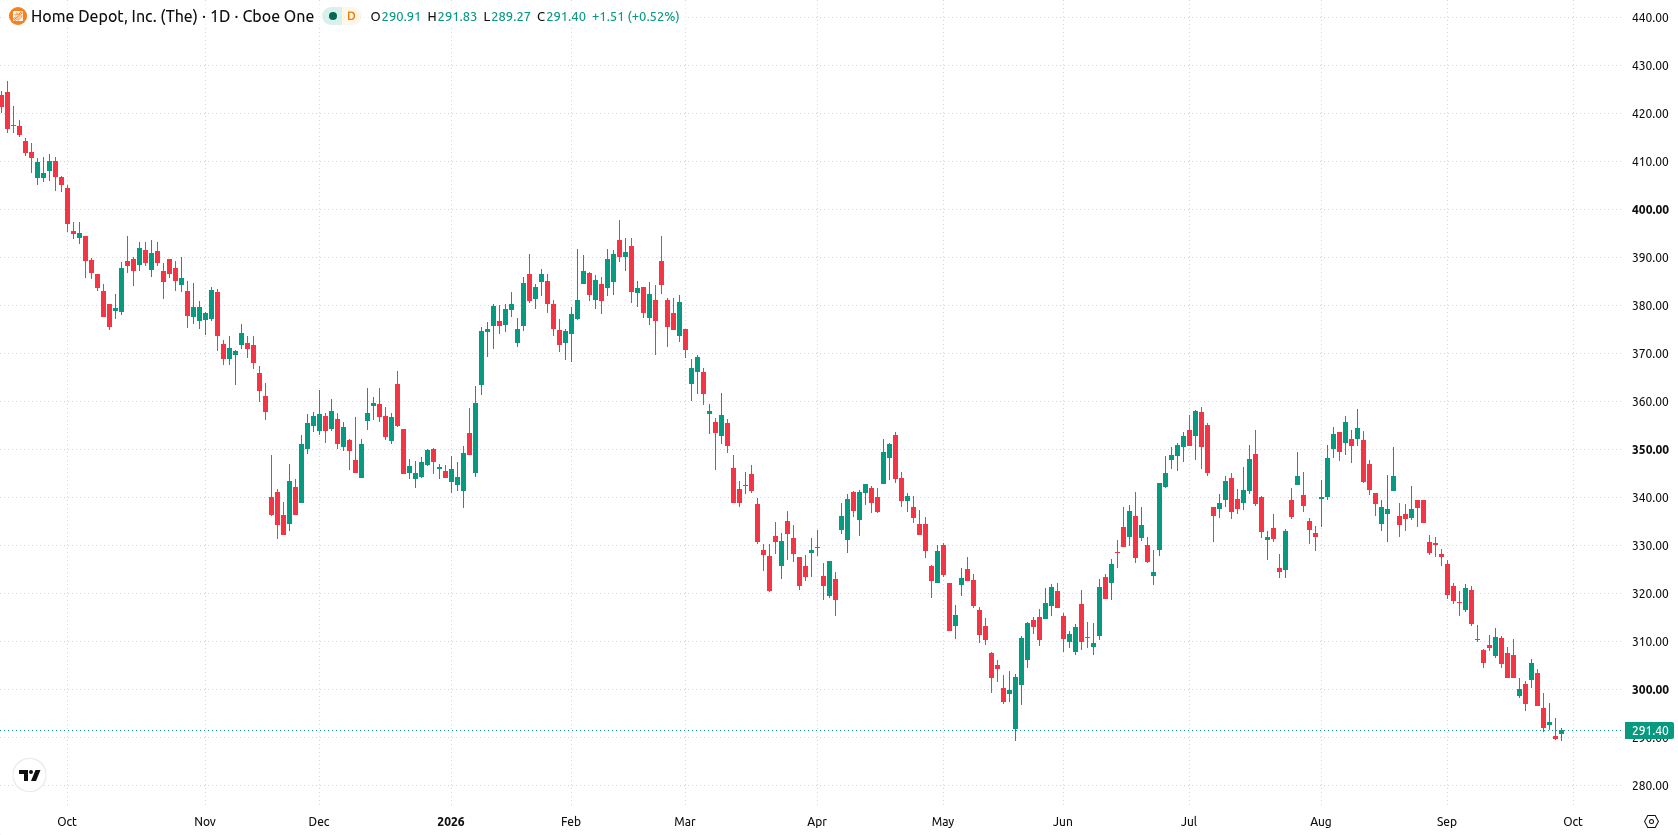
Shares of Home Depot, Inc (HD) are trading near $291 as sellers keep pressure on the setup and the technicals remain deep in oversold territory. Downward momentum is persistent, with the market watching key support levels and the impact of sustained negative sentiment into next week.
 341.51
Highlights
- Shares of Home Depot closed at $290.97, remaining well below key moving averages with a bearish long-term structure.
- Momentum indicators are oversold and downside signals persist, with support at $289.31 and resistance at $300.86.
- Next week, the projected trading range is $279.06 to $296.13, with a high probability of further decline.
Insider selling and pause in buybacks fuel scrutiny against resilient cash flow
U.S. Representative Kevin Hern disclosed on September 25, 2023 that he sold between $15,001 and $50,000 worth of HD shares on September 2, according to MarketBeat, intensifying scrutiny over insider activity. Yahoo Finance highlighted that the company's dividend yield stands at 3.19%, supported by 158 consecutive quarterly dividend payments and a 238% increase in payouts over the past decade. Secondary factors this week include HD's ongoing strong operating cash flow and its decision to pause share buybacks while contending with weak housing turnover.
Oversold technicals reinforce downward momentum as volatility rises this week
On the daily chart, the setup remains heavy, with price anchored near the bottom of the week’s range and current volatility at 3.99%. Both RSI (29.11) and CCI (-129.47) are in oversold territory, suggesting pronounced downward momentum, while MACD signals a continued sell bias. The nearest support is $289.31 and firm resistance is at $300.86, while the Ichimoku Kijun at $315.19 serves as additional overhead resistance. Momentum character points to an emerging move lower that is not yet confirmed.
Downside bias dominates next week with risk skewed to the lower range
Next week, the expected range is $279.06 to $296.13, with a very high probability of a decrease and very low probability of an increase. Base case is continued trading between $289.31 and $300.86. A push above $300.86 would challenge resistance, while a move below $289.31 risks further downside toward $279.06.
Earlier, analysts noted that Home Depot’s technical picture remained under persistent downward pressure, with bearish signals dominating the broader trend. With negative momentum intensifying and key support levels in focus, the risk of continued weakness persists, making the $289.31 level a crucial threshold for traders to watch in the coming week.






Latest Home Depot News



-
 Afghanistan
-
 Albania
-
 Algeria
-
 Angola
-
 Argentina
-
 Armenia
-
 Australia
-
 Austria
-
 Azerbaijan
-
 Bahamas
-
 Bahrain
-
 Bangladesh
-
 Belarus
-
 Belgium
-
 Bolivia
-
 Botswana
-
 Brazil
-
 Brunei
-
 Bulgaria
-
 Cambodia
-
 Cameroon
-
 Canada
-
 Chile
-
 China
-
 Colombia
-
 Congo
-
 Costa Rica
-
 Cote d'Ivoire
-
 Croatia
-
 Cuba
-
 Cyprus
-
 Czechia
-
 DR Congo
-
 Denmark
-
 Dominican Republic
-
 Ecuador
-
 Egypt
-
 El Salvador
-
 Estonia
-
 Eswatini
-
 Ethiopia
-
 Finland
-
 France
-
 Georgia
-
 Germany
-
 Ghana
-
 Greece
-
 Haiti
-
 Hong Kong
-
 Hungary
-
 India
-
 Indonesia
-
 Iran, Islamic republic
-
 Iraq
-
 Ireland
-
 Israel
-
 Italy
-
 Jamaica
-
 Japan
-
 Jordan
-
 Kazakhstan
-
 Kenya
-
 Korea
-
 Kuwait
-
 Kyrgyzstan
-
 Laos
-
 Latvia
-
 Lebanon
-
 Lesotho
-
 Libya
-
 Lithuania
-
 Luxembourg
-
 Madagascar
-
 Malaysia
-
 Malta
-
 Mauritius
-
 Mexico
-
 Moldova
-
 Mongolia
-
 Montenegro
-
 Morocco
-
 Mozambique
-
 Myanmar
-
 Namibia
-
 Nepal
-
 Netherlands
-
 New Zealand
-
 Nigeria
-
 North Macedonia
-
 Norway
-
 Oman
-
 Pakistan
-
 Palestine
-
 Panama
-
 Papua New Guinea
-
 Paraguay
-
 Peru
-
 Philippines
-
 Poland
-
 Portugal
-
 Puerto Rico
-
 Qatar
-
 Reunion
-
 Romania
-
 Rwanda
-
 Saudi Arabia
-
 Serbia
-
 Singapore
-
 Slovakia
-
 Slovenia
-
 Somalia
-
 South Africa
-
 Spain
-
 Sri Lanka
-
 Sweden
-
 Switzerland
-
 Syria
-
 Taiwan
-
 Tajikistan
-
 Tanzania
-
 Thailand
-
 Trinidad and Tobago
-
 Tunisia
-
 Turkey
-
 UAE
-
 Uganda
-
 Ukraine
-
 United Kingdom
-
United States
-
 Uruguay
-
 Uzbekistan
-
 Venezuela
-
 Vietnam
-
 Yemen
-
 Zambia
-
 Zimbabwe
- Forex
- Crypto












