


The Home Depot, Inc. (HD) climbed 2.56% as a sharp intraday rebound saw the stock recover from deeply oversold conditions, driven by momentum divergence despite the absence of fresh company news. The move contradicts the dominant bearish structure, with HD still trading below all key moving averages and technical signals heavily skewed to the downside.
 294.62
295.69
294.62
295.69
Highlights
- Home Depot stock trades below key moving averages, showing persistent short-, medium-, and long-term seller pressure.
- Technical momentum indicators such as MACD, ADX, RSI, CCI, and AO show dominant intraday selling pressure with broadly oversold conditions.
- Expected five-day range is $298.39 to $311.28, with a 79% probability of a move lower unless resistance at $311.28 is breached.
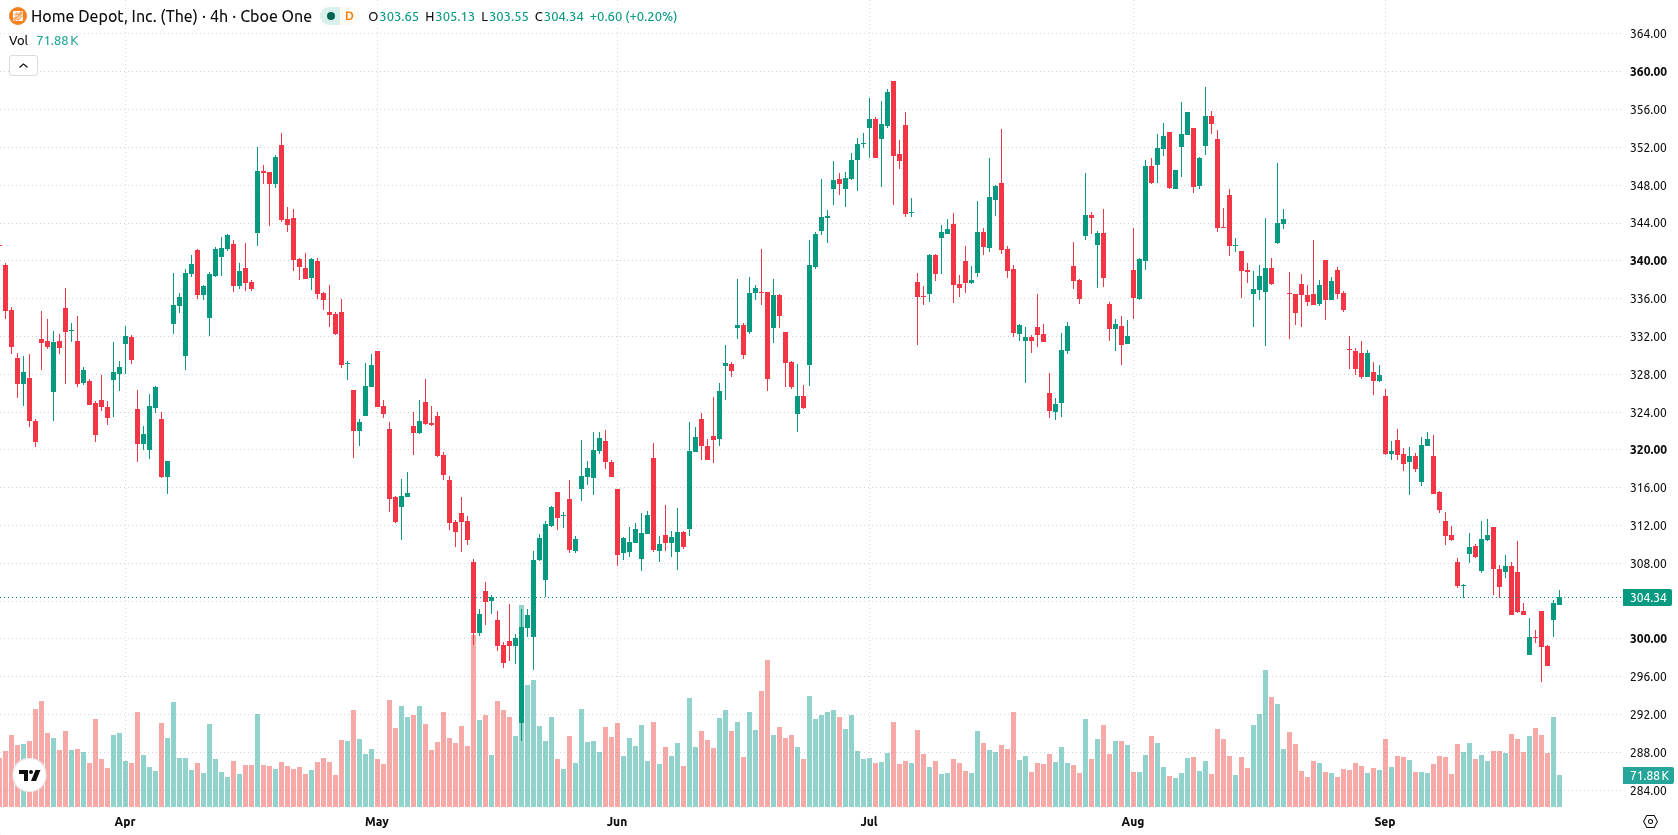
Bearish momentum persists as price action defies technical signals
Home Depot is trading below the 20-day, 50-day, and 200-day moving averages ($316.59, $330.76, and $341.9 respectively), reflecting ongoing short-, medium-, and long-term pressure from sellers. The nearest resistance is at the week high of $308.45, while intraday support is at today’s high of $302.68; both major moving averages and the Ichimoku Kijun are distant, confirming the current bearish trend. Momentum readings are weak, with the MACD and ADX both giving sell and neutral signals. The RSI sits deep in oversold territory at 26.58, accompanied by similar oversold readings in the Stochastic RSI, CCI, and BBP, all indicating dominant selling pressure intraday. The AO forecasts a sell, even as the stock posts a strong session with a $7.6 gain (up 2.56%) after an upside gap of $5.26, trading near today’s high on modest volatility of 0.81%. Intraday tone reflects strength toward the highs, contradicting persistent bearish momentum readings and signaling a divergence between short-term price action and underlying oscillators.
Earlier, analysts noted that Home Depot shares remained under sustained downward pressure, with technical signals and price action dominated by a bearish outlook. The latest rebound introduces a countertrend move but does not alter the prevailing scenario of sideways consolidation, with $311.28 now emerging as a key level to watch for any potential upside break.









-
 Afghanistan
-
 Albania
-
 Algeria
-
 Angola
-
 Argentina
-
 Armenia
-
 Australia
-
 Austria
-
 Azerbaijan
-
 Bahamas
-
 Bahrain
-
 Bangladesh
-
 Belarus
-
 Belgium
-
 Bolivia
-
 Botswana
-
 Brazil
-
 Brunei
-
 Bulgaria
-
 Cambodia
-
 Cameroon
-
 Canada
-
 Chile
Chile
-
 China
China
-
 Colombia
-
 Congo
Congo
-
 Costa Rica
-
 Cote d'Ivoire
-
 Croatia
-
 Cuba
Cuba
-
 Cyprus
-
 Czechia
-
 DR Congo
-
 Denmark
-
 Dominican Republic
-
 Ecuador
-
 Egypt
Egypt
-
 El Salvador
-
 Estonia
-
 Eswatini
-
 Ethiopia
-
 Finland
-
 France
-
 Georgia
-
 Germany
-
 Ghana
Ghana
-
 Greece
-
 Haiti
Haiti
-
 Hong Kong
-
 Hungary
-
 India
India
-
 Indonesia
-
 Iran, Islamic republic
-
 Iraq
Iraq
-
 Ireland
-
 Israel
-
 Italy
Italy
-
 Jamaica
-
 Japan
Japan
-
 Jordan
-
 Kazakhstan
-
 Kenya
Kenya
-
 Korea
Korea
-
 Kuwait
-
 Kyrgyzstan
-
 Laos
Laos
-
 Latvia
-
 Lebanon
-
 Lesotho
-
 Libya
Libya
-
 Lithuania
-
 Luxembourg
-
 Madagascar
-
 Malaysia
-
 Malta
Malta
-
 Mauritius
-
 Mexico
-
 Moldova
-
 Mongolia
-
 Montenegro
-
 Morocco
-
 Mozambique
-
 Myanmar
-
 Namibia
-
 Nepal
Nepal
-
 Netherlands
-
 New Zealand
-
 Nigeria
-
 North Macedonia
-
 Norway
-
 Oman
Oman
-
 Pakistan
-
 Palestine
-
 Panama
-
 Papua New Guinea
-
 Paraguay
-
 Peru
Peru
-
 Philippines
-
 Poland
-
 Portugal
-
 Puerto Rico
-
 Qatar
Qatar
-
 Reunion
-
 Romania
-
 Rwanda
-
 Saudi Arabia
-
 Serbia
-
 Singapore
-
 Slovakia
-
 Slovenia
-
 Somalia
-
 South Africa
-
 Spain
Spain
-
 Sri Lanka
-
 Sweden
-
 Switzerland
-
 Syria
Syria
-
 Taiwan
-
 Tajikistan
-
 Tanzania
-
 Thailand
-
 Trinidad and Tobago
-
 Tunisia
-
 Turkey
-
 UAE
UAE
-
 Uganda
-
 Ukraine
-
 United Kingdom
-
United States
-
 Uruguay
-
 Uzbekistan
-
 Venezuela
-
 Vietnam
-
 Yemen
Yemen
-
 Zambia
-
 Zimbabwe
- Forex
- Crypto












