

Steel Dynamics stock faces seller pressure: Downside targets to watch

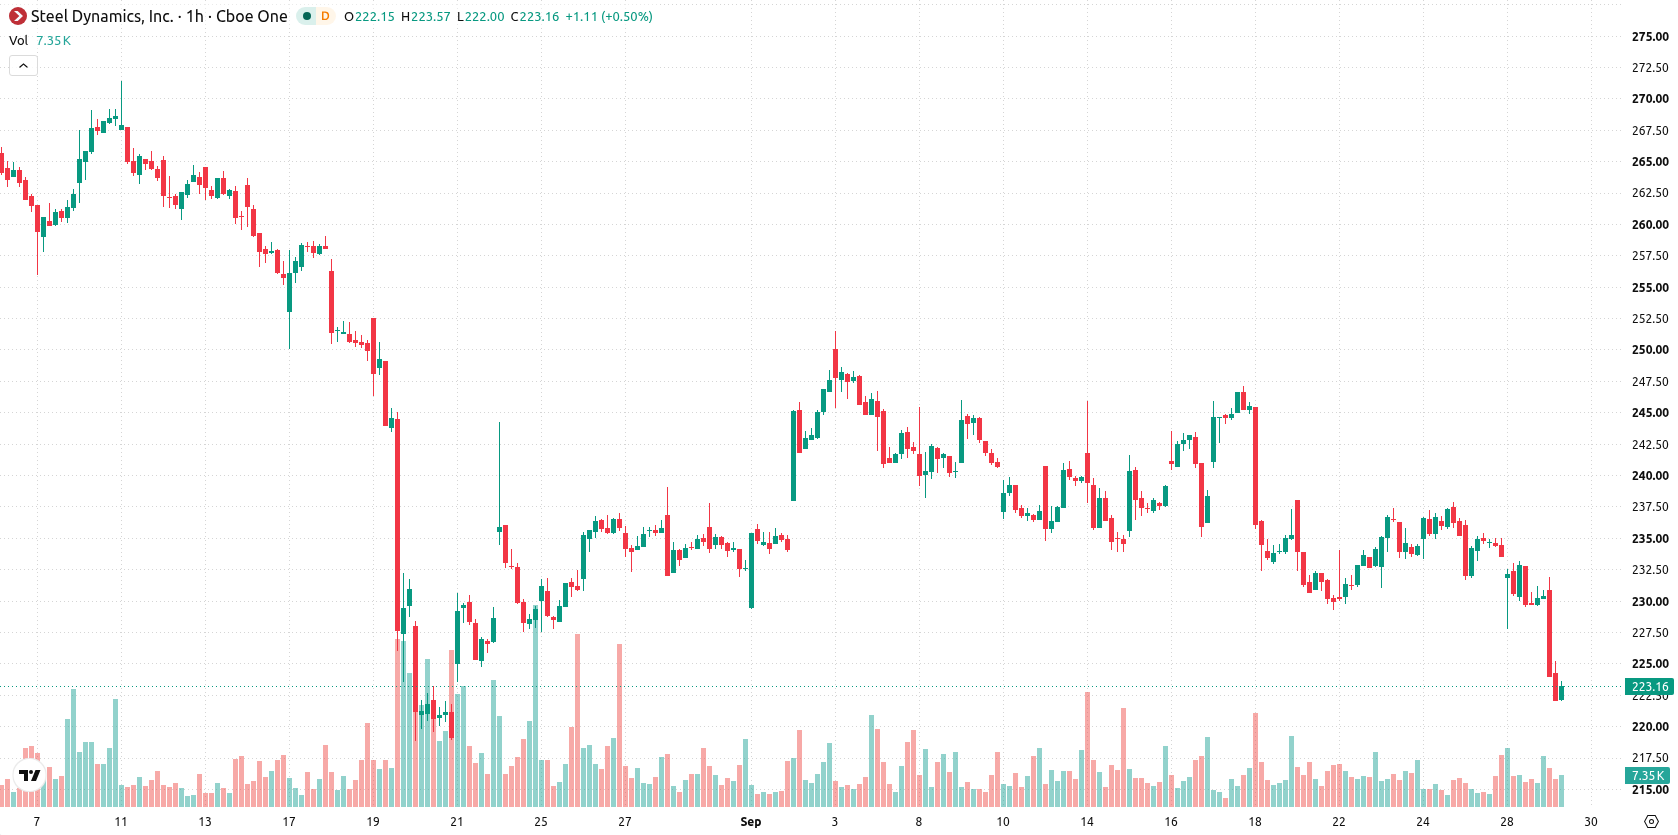
Steel Dynamics (STLD) stock is trading at $222.96, down 3.23% for the day. The price is currently holding below its main short- and medium-term moving averages, while staying above longer-term support levels.
 253.21
253.99
Highlights
- Steel Dynamics declared a quarterly dividend of $0.53 per share, with a record date of September 30 and payment on October 9.
- The annualized dividend of $2.12 results in a 0.9% yield and establishes set dates for capital return.
- Shares of Steel Dynamics fell 3.23% to $222.96 and remain under bearish momentum, with an expected trading range of $216.76 to $227.63.
Dividend timetable steers flows amid persistent selling pressure
Steel Dynamics, Inc. declared a quarterly dividend of $0.53 per share, with shareholders as of September 30 eligible for payment on October 9, according to MarketBeat. This results in an annualized dividend of $2.12 and equates to a 0.9% yield, establishing a defined timetable for capital return and potentially influencing short-term investor flows around the record and ex-dividend dates. Such announcements typically prompt both income-seeking positioning and post-dividend rebalancing, though price action has remained under broader selling pressure.
Oversold signals and intraday weakness cap upside attempts
On the technical front, STLD is trading below its MA-20 and MA-50 on the hourly chart, which signals ongoing short- and medium-term downside pressure, while price remains above the long-term MA-200. Immediate resistance is identified at the Ichimoku Kijun level of $230.93, with support anchored at $216.76. Momentum indicators are broadly negative: RSI stands at 32.32, indicating oversold conditions; MACD is in Sell mode; and Stochastic RSI as well as CCI are also oversold. The ADX is Neutral, while Bull/Bear Power and the Awesome Oscillator both demonstrate intraday selling dominance.
Downside bias dominates as volatility keeps range in focus
In the short term, STLD is expected to trade in the range of $216.76 to $227.63, with high volatility likely to persist. Probability models indicate a 23% chance of an upward move and a 77% likelihood of further downside. The baseline scenario sees consolidation between these support and resistance levels. Should the price break above $230.93, a shift toward short-term strength may develop; conversely, falling below $216.76 would open the way for additional declines.
Earlier, analysts noted that Steel Dynamics was experiencing persistent downside momentum, with technical indicators and price action confirming a broadly bearish outlook despite ongoing dividend payments. The current analysis corroborates this view, highlighting that sustained selling pressure and prevailing volatility put particular focus on the key $230.93 resistance level as a trigger for any potential recovery.






Latest Steel Dynamics Inc News




-
 Afghanistan
-
 Albania
-
 Algeria
-
 Angola
-
 Argentina
-
 Armenia
-
 Australia
-
 Austria
-
 Azerbaijan
-
 Bahamas
-
 Bahrain
-
 Bangladesh
-
 Belarus
-
 Belgium
-
 Bolivia
-
 Botswana
-
 Brazil
-
 Brunei
-
 Bulgaria
-
 Cambodia
-
 Cameroon
-
 Canada
-
 Chile
-
 China
-
 Colombia
-
 Congo
-
 Costa Rica
-
 Cote d'Ivoire
-
 Croatia
-
 Cuba
-
 Cyprus
-
 Czechia
-
 DR Congo
-
 Denmark
-
 Dominican Republic
-
 Ecuador
-
 Egypt
-
 El Salvador
-
 Estonia
-
 Eswatini
-
 Ethiopia
-
 Finland
-
 France
-
 Georgia
-
 Germany
-
 Ghana
-
 Greece
-
 Haiti
-
 Hong Kong
-
 Hungary
-
 India
-
 Indonesia
-
 Iran, Islamic republic
-
 Iraq
-
 Ireland
-
 Israel
-
 Italy
-
 Jamaica
-
 Japan
-
 Jordan
-
 Kazakhstan
-
 Kenya
-
 Korea
-
 Kuwait
-
 Kyrgyzstan
-
 Laos
-
 Latvia
-
 Lebanon
-
 Lesotho
-
 Libya
-
 Lithuania
-
 Luxembourg
-
 Madagascar
-
 Malaysia
-
 Malta
-
 Mauritius
-
 Mexico
-
 Moldova
-
 Mongolia
-
 Montenegro
-
 Morocco
-
 Mozambique
-
 Myanmar
-
 Namibia
-
 Nepal
-
 Netherlands
-
 New Zealand
-
 Nigeria
-
 North Macedonia
-
 Norway
-
 Oman
-
 Pakistan
-
 Palestine
-
 Panama
-
 Papua New Guinea
-
 Paraguay
-
 Peru
-
 Philippines
-
 Poland
-
 Portugal
-
 Puerto Rico
-
 Qatar
-
 Reunion
-
 Romania
-
 Rwanda
-
 Saudi Arabia
-
 Serbia
-
 Singapore
-
 Slovakia
-
 Slovenia
-
 Somalia
-
 South Africa
-
 Spain
-
 Sri Lanka
-
 Sweden
-
 Switzerland
-
 Syria
-
 Taiwan
-
 Tajikistan
-
 Tanzania
-
 Thailand
-
 Trinidad and Tobago
-
 Tunisia
-
 Turkey
-
 UAE
-
 Uganda
-
 Ukraine
-
 United Kingdom
-
United States
-
 Uruguay
-
 Uzbekistan
-
 Venezuela
-
 Vietnam
-
 Yemen
-
 Zambia
-
 Zimbabwe
- Forex
- Crypto












