

Rebound slows on overbought conditions: Can NNDM extend gains?

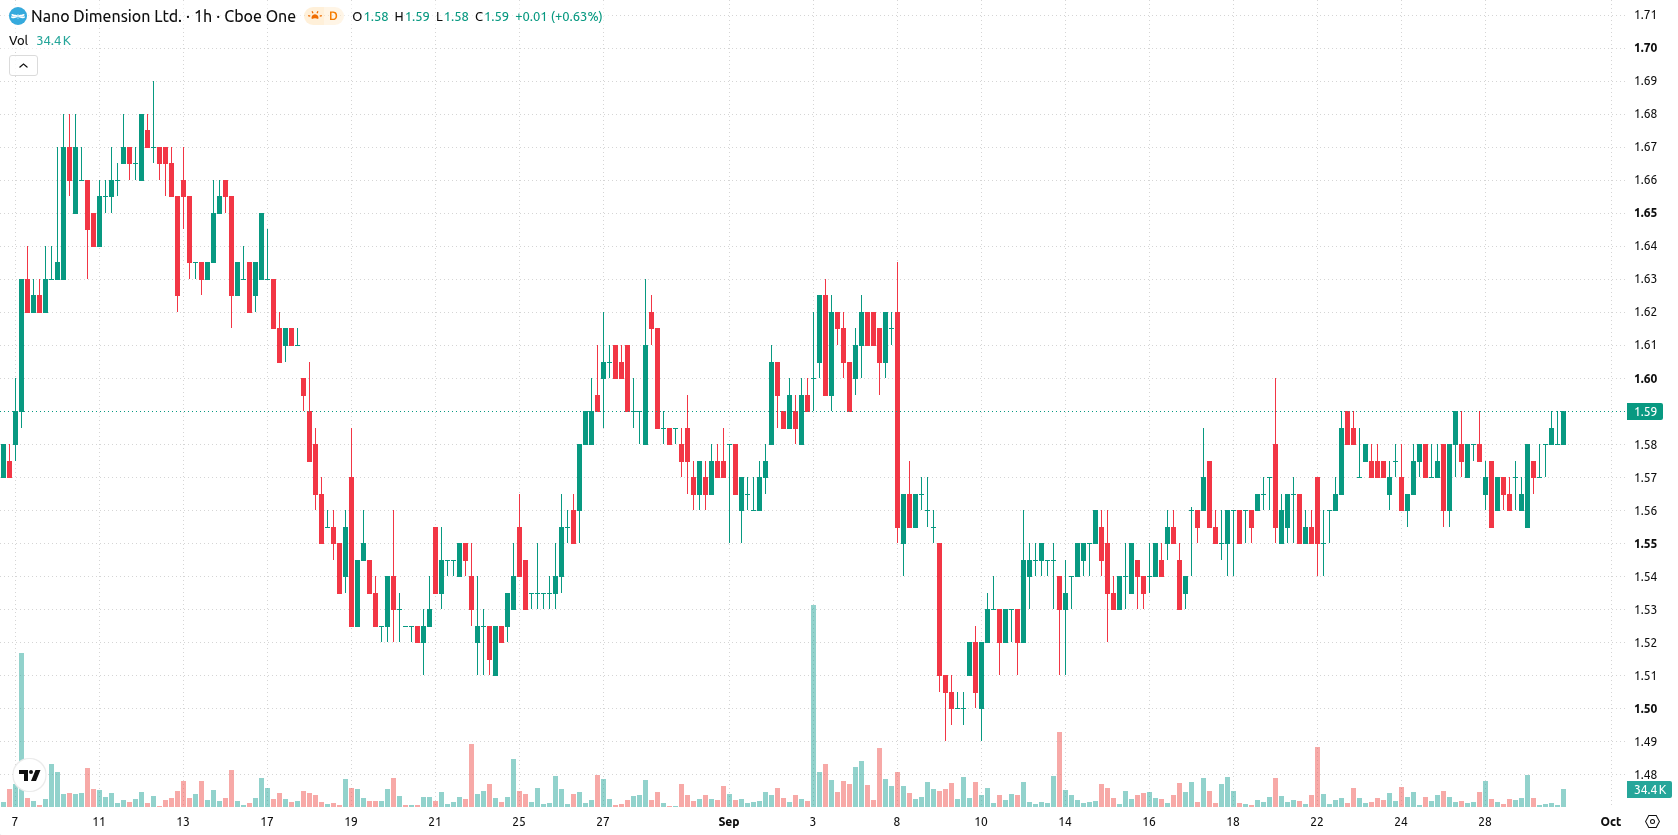
Nano Dimension (NNDM) stock is trading at $1.58 after climbing 1.28% on the day, finishing near session highs. The price remains positioned above its key moving averages across the short and medium term but has not surpassed longer-term trend levels.
 1.28
1.38
Highlights
- NNDM stock trades above short and medium-term moving averages but remains below its long-term moving average, showing short-term upward momentum with ongoing long-term selling pressure.
- Momentum indicators are mixed, with MACD and Bull/Bear Power bullish, but CCI flashing overbought and several oscillators neutral, indicating conflicting signals.
- The expected trading range for NNDM stock in upcoming sessions is $1.56 to $1.60, with a high probability of continued upward movement and low chance of a decline.
Mixed momentum as overbought signals meet bullish bias
NNDM is currently trading above the MA-20 and MA-50 at $1.57, while remaining below the MA-200 at $1.66. The Ichimoku Kijun at $1.57 is acting as immediate support for price action. MACD signals bullish momentum, while the ADX indicator remains neutral, suggesting moderate trend strength. The RSI indicator shows conditions in buy territory, with Bull/Bear Power tilting in favor of buyers. However, the CCI is pointing to overbought conditions, and Stochastic RSI is neutral, reflecting a mix of near-term oscillator signals.
Tight trading range expected as upside risk dominates
In the short term, NNDM is expected to trade within a volatility band of $1.56 to $1.60. The probability of continued upward movement is very high, with a low likelihood of a downside scenario. The baseline outlook anticipates price consolidation within this range, while a bullish scenario could be triggered by a breakout above $1.60; conversely, a move below $1.57 may open the way for further downside.
Earlier, analysts noted that Nano Dimension shares were entering a phase of consolidation as technical signals pointed to a mixed, rangebound outlook. The latest indicators reinforce this scenario, but with current upside momentum prevailing, traders should monitor $1.60 as a potential breakout trigger for a new trend development.






Latest Nano Dimension News




-
 Afghanistan
-
 Albania
-
 Algeria
-
 Angola
-
 Argentina
-
 Armenia
-
 Australia
-
 Austria
-
 Azerbaijan
-
 Bahamas
-
 Bahrain
-
 Bangladesh
-
 Belarus
-
 Belgium
-
 Bolivia
-
 Botswana
-
 Brazil
-
 Brunei
-
 Bulgaria
-
 Cambodia
-
 Cameroon
-
 Canada
-
 Chile
-
 China
-
 Colombia
-
 Congo
-
 Costa Rica
-
 Cote d'Ivoire
-
 Croatia
-
 Cuba
-
 Cyprus
-
 Czechia
-
 DR Congo
-
 Denmark
-
 Dominican Republic
-
 Ecuador
-
 Egypt
-
 El Salvador
-
 Estonia
-
 Eswatini
-
 Ethiopia
-
 Finland
-
 France
-
 Georgia
-
 Germany
-
 Ghana
-
 Greece
-
 Haiti
-
 Hong Kong
-
 Hungary
-
 India
-
 Indonesia
-
 Iran, Islamic republic
-
 Iraq
-
 Ireland
-
 Israel
-
 Italy
-
 Jamaica
-
 Japan
-
 Jordan
-
 Kazakhstan
-
 Kenya
-
 Korea
-
 Kuwait
-
 Kyrgyzstan
-
 Laos
-
 Latvia
-
 Lebanon
-
 Lesotho
-
 Libya
-
 Lithuania
-
 Luxembourg
-
 Madagascar
-
 Malaysia
-
 Malta
-
 Mauritius
-
 Mexico
-
 Moldova
-
 Mongolia
-
 Montenegro
-
 Morocco
-
 Mozambique
-
 Myanmar
-
 Namibia
-
 Nepal
-
 Netherlands
-
 New Zealand
-
 Nigeria
-
 North Macedonia
-
 Norway
-
 Oman
-
 Pakistan
-
 Palestine
-
 Panama
-
 Papua New Guinea
-
 Paraguay
-
 Peru
-
 Philippines
-
 Poland
-
 Portugal
-
 Puerto Rico
-
 Qatar
-
 Reunion
-
 Romania
-
 Rwanda
-
 Saudi Arabia
-
 Serbia
-
 Singapore
-
 Slovakia
-
 Slovenia
-
 Somalia
-
 South Africa
-
 Spain
-
 Sri Lanka
-
 Sweden
-
 Switzerland
-
 Syria
-
 Taiwan
-
 Tajikistan
-
 Tanzania
-
 Thailand
-
 Trinidad and Tobago
-
 Tunisia
-
 Turkey
-
 UAE
-
 Uganda
-
 Ukraine
-
 United Kingdom
-
United States
-
 Uruguay
-
 Uzbekistan
-
 Venezuela
-
 Vietnam
-
 Yemen
-
 Zambia
-
 Zimbabwe
- Forex
- Crypto












