

Arm Holdings shares drop more than 3% after mixed technical momentum and ETF share sales

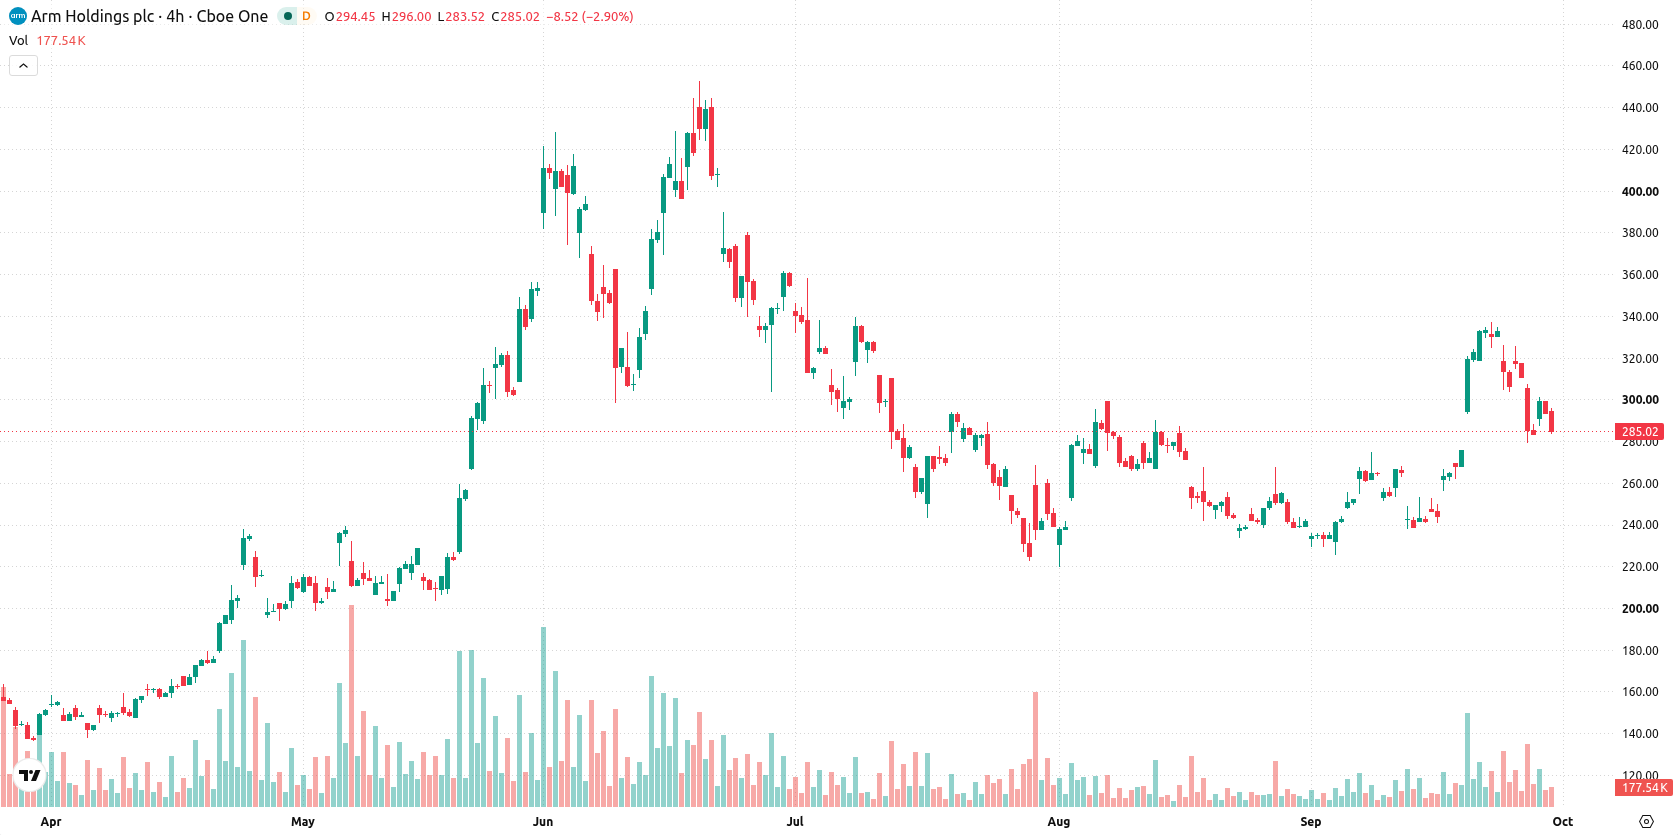
Arm Holdings (ARM) dropped 3.06% after recent selling pressure emerged, even as recent fiscal results showed strong revenue growth and wider data center adoption. This decline is reinforced by conflicting technical signals, with the stock still above key moving averages but facing a mixed momentum backdrop.
 170.65
191.65
Highlights
- Arm Holdings reported a 22.4% year-on-year increase in fiscal Q1 revenue for fiscal 2026.
- ETF-linked transactions resulted in $26.7 million in shares of Arm sold on September 25, 2026, as adoption of its data center chip technology grew among clients like NVIDIA, Google, and AWS.
- Arm stock is in a broad $261.44 to $307.91 projected range this week, trading near key technical supports with oscillators indicating buyers dominate but with a neutral trend signal.
ETF-driven selling offsets revenue growth and wider chip adoption
Arm Holdings released its fiscal 2026 annual report, which recorded a 22.4% year-on-year increase in fiscal Q1 revenue. On September 25, 2026, $26.7 million worth of Arm shares were sold through ETF activity. The company also reported greater adoption of its data center chip technology by clients including NVIDIA, Google, and AWS, though price action has remained under broader selling pressure.
Mixed oscillator signals temper bullish trend above moving averages
Arm is trading above its 20-day ($272.76), 50-day ($265.09), and 200-day ($213.29) moving averages, reflecting persistent bullish momentum across short-, medium-, and long-term timeframes. Immediately, the near-term ceiling stands at $293 with potential support from the Ichimoku Kijun at $280.65, and overall MA-50 versus MA-200 alignment remains bullish. Momentum signals present a mixed picture. Moving Average Convergence Divergence (MACD) and Relative Strength Index (RSI) both suggest buying, but Average Directional Index (ADX) indicates a neutral trend, echoed by the Stochastic RSI. Commodity Channel Index (CCI) favors buyers and Bull/Bear Power (BBP) confirms buyers remain dominant, though its 'Overbought' forecast signals caution. The stock is down to $284.67, falling $8.9979 or 3.06% after an upside gap of 0.33 ($0.33, 0.11%). It now sits near the session low with intraday volatility at 0.58%. The session reflects selling pressure following the gap open, and momentum signals are not fully aligned, showing a divergence between supportive oscillators and neutral trend metrics.
Earlier, analysts noted that Arm Holdings was showing emerging downside risks, driven by volatility and dominant bearish technical momentum. The current analysis adds a new dimension, with improved revenue and data center adoption potentially offsetting recent selling pressure; traders should monitor the $293 resistance and $280.65 support as key levels for a directional breakout.










-
 Afghanistan
-
 Albania
-
 Algeria
-
 Angola
-
 Argentina
-
 Armenia
-
 Australia
-
 Austria
-
 Azerbaijan
-
 Bahamas
-
 Bahrain
-
 Bangladesh
-
 Belarus
-
 Belgium
-
 Bolivia
-
 Botswana
-
 Brazil
-
 Brunei
-
 Bulgaria
-
 Cambodia
-
 Cameroon
-
 Canada
-
 Chile
-
 China
-
 Colombia
-
 Congo
-
 Costa Rica
-
 Cote d'Ivoire
-
 Croatia
-
 Cuba
-
 Cyprus
-
 Czechia
-
 DR Congo
-
 Denmark
-
 Dominican Republic
-
 Ecuador
-
 Egypt
-
 El Salvador
-
 Estonia
-
 Eswatini
-
 Ethiopia
-
 Finland
-
 France
-
 Georgia
-
 Germany
-
 Ghana
-
 Greece
-
 Haiti
-
 Hong Kong
-
 Hungary
-
 India
-
 Indonesia
-
 Iran, Islamic republic
-
 Iraq
-
 Ireland
-
 Israel
-
 Italy
-
 Jamaica
-
 Japan
-
 Jordan
-
 Kazakhstan
-
 Kenya
-
 Korea
-
 Kuwait
-
 Kyrgyzstan
-
 Laos
-
 Latvia
-
 Lebanon
-
 Lesotho
-
 Libya
-
 Lithuania
-
 Luxembourg
-
 Madagascar
-
 Malaysia
-
 Malta
-
 Mauritius
-
 Mexico
-
 Moldova
-
 Mongolia
-
 Montenegro
-
 Morocco
-
 Mozambique
-
 Myanmar
-
 Namibia
-
 Nepal
-
 Netherlands
-
 New Zealand
-
 Nigeria
-
 North Macedonia
-
 Norway
-
 Oman
-
 Pakistan
-
 Palestine
-
 Panama
-
 Papua New Guinea
-
 Paraguay
-
 Peru
-
 Philippines
-
 Poland
-
 Portugal
-
 Puerto Rico
-
 Qatar
-
 Reunion
-
 Romania
-
 Rwanda
-
 Saudi Arabia
-
 Serbia
-
 Singapore
-
 Slovakia
-
 Slovenia
-
 Somalia
-
 South Africa
-
 Spain
-
 Sri Lanka
-
 Sweden
-
 Switzerland
-
 Syria
-
 Taiwan
-
 Tajikistan
-
 Tanzania
-
 Thailand
-
 Trinidad and Tobago
-
 Tunisia
-
 Turkey
-
 UAE
-
 Uganda
-
 Ukraine
-
 United Kingdom
-
United States
-
 Uruguay
-
 Uzbekistan
-
 Venezuela
-
 Vietnam
-
 Yemen
-
 Zambia
-
 Zimbabwe
- Forex
- Crypto












