

Why is Autodesk stock up today? AI automation and new PLM drive rally, $212.73 resistance in focus

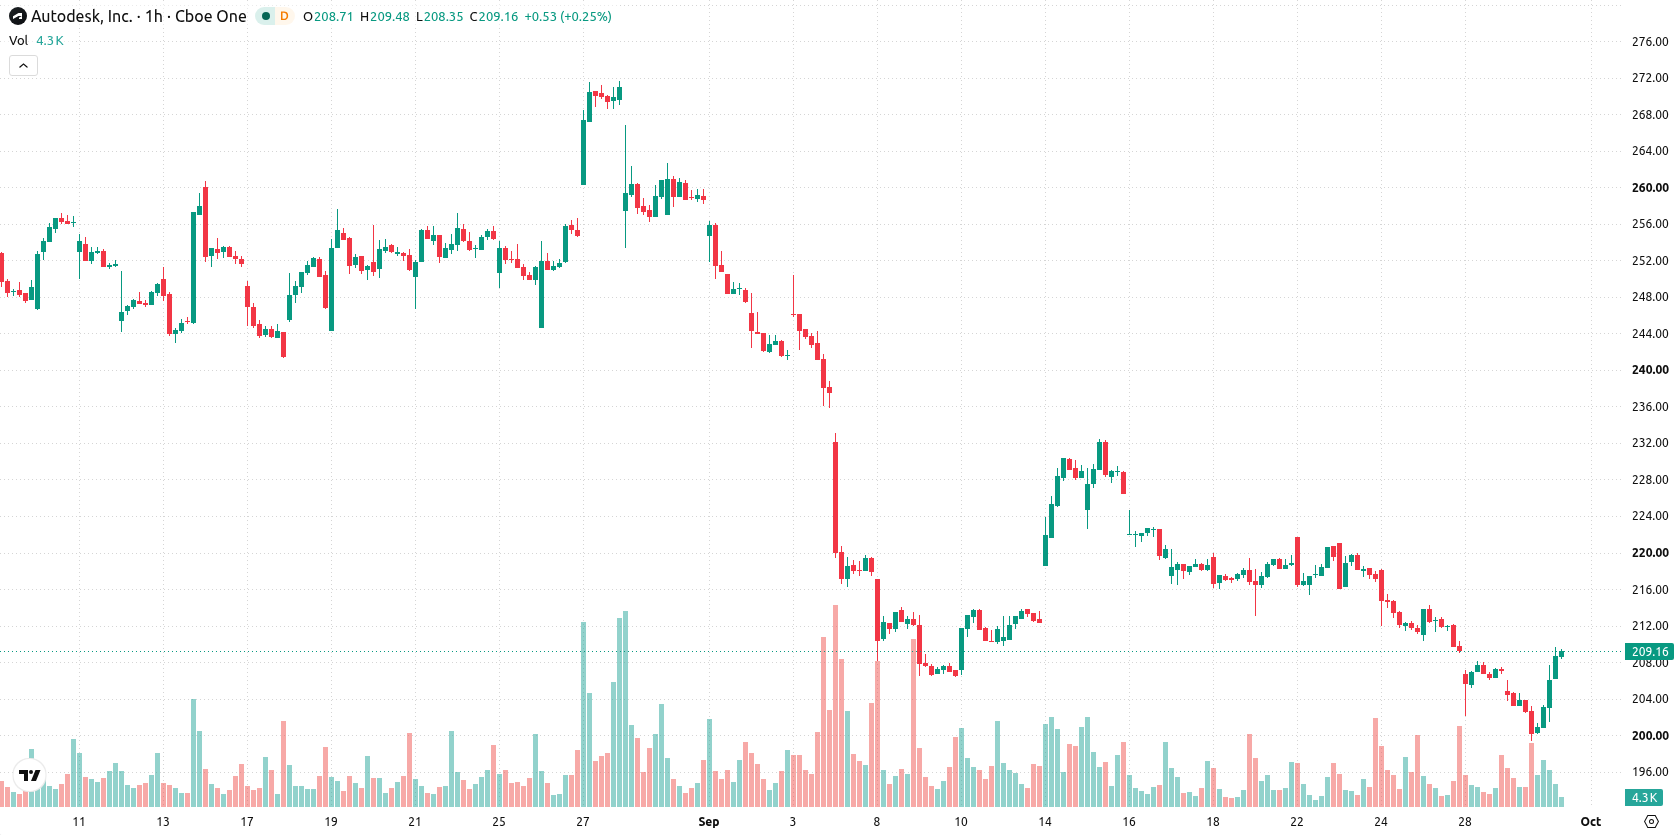
Autodesk Inc. (ADSK) stock is trading at $209.33 after rising 3.03% on the day and sits above its short-term moving averages while remaining below the medium- and long-term trendlines.
 250.63
252.20
Highlights
- Autodesk expanded AI features in Fusion to automate design and manufacturing tasks, increasing productivity and workflow automation appeal.
- A new agentic PLM experience and the Assistant feature in Inventor and Vault deepen AI integration and strengthen ecosystem connectivity.
- Autodesk stock trades above short-term support but faces bearish momentum, with a $199.13 to $217.53 range seen and downside bias at 59%.
Ecosystem value rises as AI deepens design integration
Autodesk has expanded its AI capabilities within Fusion to automate repetitive design and manufacturing tasks, directly increasing engineering productivity and positioning the platform as a go-to solution for workflow automation. The company's introduction of a new agentic PLM experience further connects product data and enhances decision-making across engineering teams, raising the attractiveness of its ecosystem for collaborative work. Additionally, according to Itwire, the rollout of the Assistant feature into Inventor and Vault integrates AI support into everyday engineering tools, making adoption seamless and likely facilitating broader platform engagement.
Mixed momentum as bearish signals clash with intraday gains
The 20-day moving average stands at $206.71, with the 50-day and 200-day averages at $212.73 and $240.25, respectively, setting clear resistance at $212.73 and higher resistance around $240.25. Support sits near the Ichimoku Kijun at $207.07. MACD and ADX both indicate a sell bias, and RSI remains in selling territory at 35.84, as does CCI, while Bull/Bear Power is flagged as oversold. Conversely, Stoch RSI is showing overbought conditions, and the Awesome Oscillator registers a neutral reading. These mixed oscillator signals highlight a divergence between rapid intraday upward momentum and lingering bearish pressure from broader momentum indicators.
Downside risk prevails amid volatile near-term trading range
Over the near term, ADSK is expected to trade between $199.13 and $217.53, reflecting typical volatility relative to current levels. The probability of a downward move is higher, at 59%, versus a 41% chance of a sustained upward break. If the price breaks above resistance, a move toward the upper forecast band is possible, while a drop below immediate support would likely result in a move toward the lower end of the expected range. Most base case scenarios suggest oscillation between current support and resistance as market participants reconcile mixed technical signals.
Earlier, analysts noted that Autodesk’s stock continued to display persistent downside momentum despite ongoing innovation and AI partnerships. The current technical landscape signals oscillation around key moving averages with elevated downside risk, making it critical for traders to monitor the $212.73 resistance for any sign of a sustained shift in direction.











-
 Afghanistan
-
 Albania
-
 Algeria
-
 Angola
-
 Argentina
-
 Armenia
-
 Australia
-
 Austria
-
 Azerbaijan
-
 Bahamas
-
 Bahrain
-
 Bangladesh
-
 Belarus
-
 Belgium
-
 Bolivia
-
 Botswana
-
 Brazil
-
 Brunei
-
 Bulgaria
-
 Cambodia
-
 Cameroon
-
 Canada
-
 Chile
-
 China
-
 Colombia
-
 Congo
-
 Costa Rica
-
 Cote d'Ivoire
-
 Croatia
-
 Cuba
-
 Cyprus
-
 Czechia
-
 DR Congo
-
 Denmark
-
 Dominican Republic
-
 Ecuador
-
 Egypt
-
 El Salvador
-
 Estonia
-
 Eswatini
-
 Ethiopia
-
 Finland
-
 France
-
 Georgia
-
 Germany
-
 Ghana
-
 Greece
-
 Haiti
-
 Hong Kong
-
 Hungary
-
 India
-
 Indonesia
-
 Iran, Islamic republic
-
 Iraq
-
 Ireland
-
 Israel
-
 Italy
-
 Jamaica
-
 Japan
-
 Jordan
-
 Kazakhstan
-
 Kenya
-
 Korea
-
 Kuwait
-
 Kyrgyzstan
-
 Laos
-
 Latvia
-
 Lebanon
-
 Lesotho
-
 Libya
-
 Lithuania
-
 Luxembourg
-
 Madagascar
-
 Malaysia
-
 Malta
-
 Mauritius
-
 Mexico
-
 Moldova
-
 Mongolia
-
 Montenegro
-
 Morocco
-
 Mozambique
-
 Myanmar
-
 Namibia
-
 Nepal
-
 Netherlands
-
 New Zealand
-
 Nigeria
-
 North Macedonia
-
 Norway
-
 Oman
-
 Pakistan
-
 Palestine
-
 Panama
-
 Papua New Guinea
-
 Paraguay
-
 Peru
-
 Philippines
-
 Poland
-
 Portugal
-
 Puerto Rico
-
 Qatar
-
 Reunion
-
 Romania
-
 Rwanda
-
 Saudi Arabia
-
 Serbia
-
 Singapore
-
 Slovakia
-
 Slovenia
-
 Somalia
-
 South Africa
-
 Spain
-
 Sri Lanka
-
 Sweden
-
 Switzerland
-
 Syria
-
 Taiwan
-
 Tajikistan
-
 Tanzania
-
 Thailand
-
 Trinidad and Tobago
-
 Tunisia
-
 Turkey
-
 UAE
-
 Uganda
-
 Ukraine
-
 United Kingdom
-
United States
-
 Uruguay
-
 Uzbekistan
-
 Venezuela
-
 Vietnam
-
 Yemen
-
 Zambia
-
 Zimbabwe
- Forex
- Crypto












