


Flex Ltd (FLEX) declined 3.02% as technical selling momentum picked up and intraday volatility stayed elevated. The move is supported by the stock trading below both its 20-day and 50-day moving averages, indicating persistent near-term and medium-term seller pressure.
 89.69
95.07
Highlights
- Shares of Flex fell 3.02% to $110.39 and are trading below short- and medium-term moving averages.
- Near-term momentum signals are mixed, with selling pressure indicated but overbought conditions appearing on intraday indicators.
- Flex is expected to trade in a $104.65 to $116.13 range over the next five days, with 42% downside and 58% upside probability.
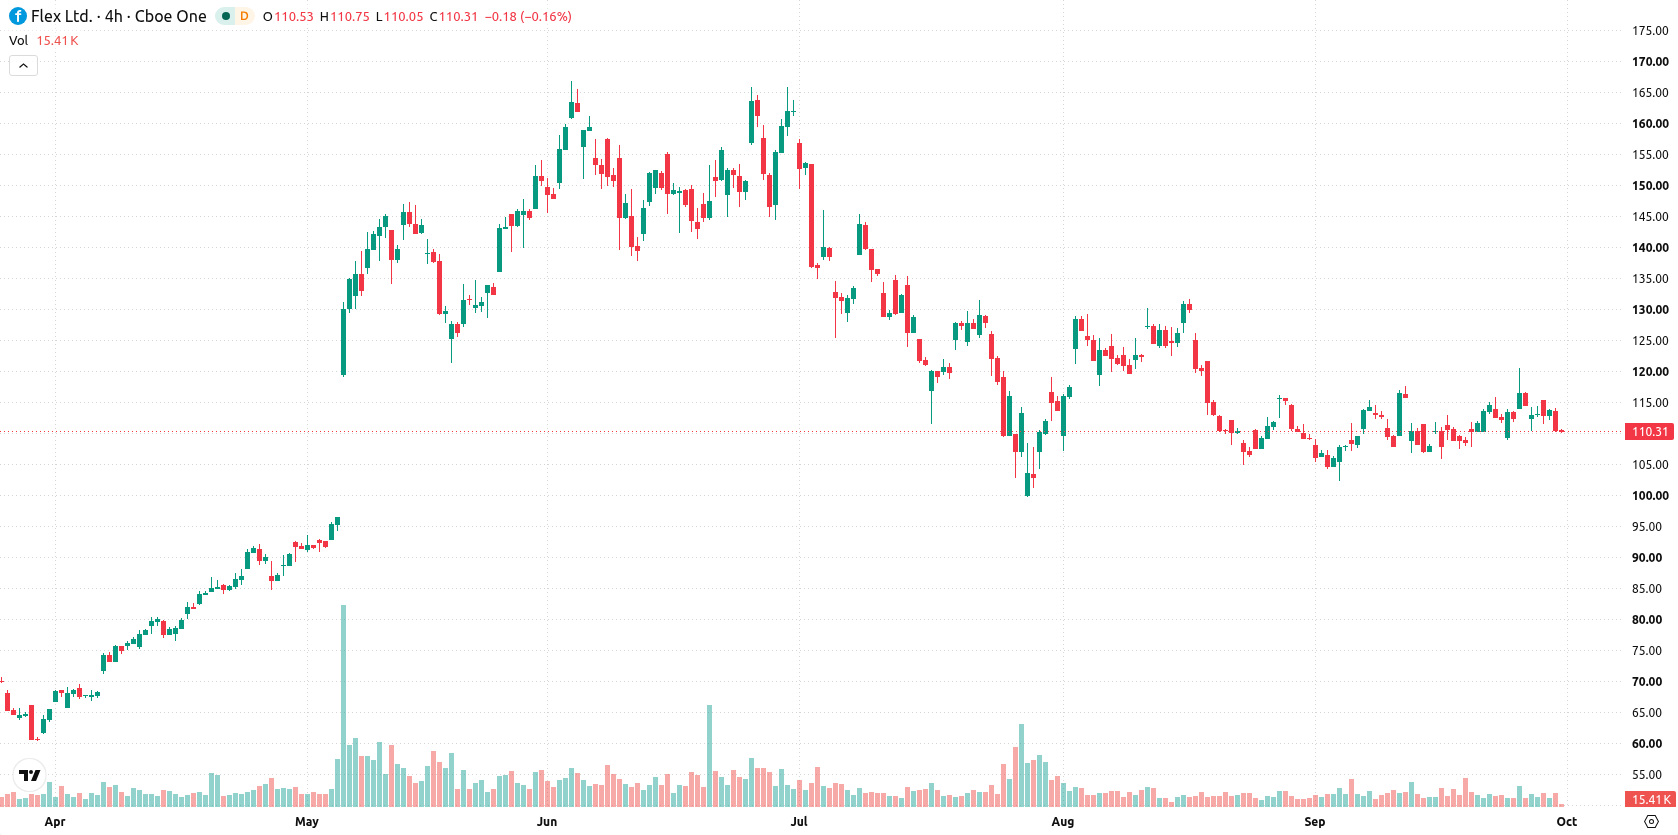
Mixed technical signals as seller strength meets overbought readings
Flex is trading below both its 20-day and 50-day moving averages ($110.76 and $114.96), but remains above the 200-day average at $98.95. This points to continued seller pressure in the near and medium term, despite a lingering long-term bullish structure. The nearest resistance is at $110.76 with immediate support at $110.13. Momentum readings are mixed: MACD highlights strong selling, the ADX is neutral, and the RSI is mid-range but suggests a buy. Stochastic RSI and Bull/Bear Power indicate overbought conditions with buyers in control intraday, while the CCI continues to signal a buy. The Awesome Oscillator is neutral. The price is near the session's lows and intraday volatility is high at 3.54%, with divergences between selling momentum and overbought signals adding uncertainty.
Earlier, analysts noted that Flex had rebounded strongly, with technical indicators showing an improving trend but warning that further gains hinged on overcoming key resistance. The current breakdown beneath short- and medium-term averages signals a shift toward persistent selling momentum, making $110.13 a key support level to monitor for potential downside risk in the coming sessions.






Latest Flex Ltd News




-
 Afghanistan
-
 Albania
-
 Algeria
-
 Angola
-
 Argentina
-
 Armenia
-
 Australia
-
 Austria
-
 Azerbaijan
-
 Bahamas
-
 Bahrain
-
 Bangladesh
-
 Belarus
-
 Belgium
-
 Bolivia
-
 Botswana
-
 Brazil
-
 Brunei
-
 Bulgaria
-
 Cambodia
-
 Cameroon
-
 Canada
-
 Chile
-
 China
-
 Colombia
-
 Congo
-
 Costa Rica
-
 Cote d'Ivoire
-
 Croatia
-
 Cuba
-
 Cyprus
-
 Czechia
-
 DR Congo
-
 Denmark
-
 Dominican Republic
-
 Ecuador
-
 Egypt
-
 El Salvador
-
 Estonia
-
 Eswatini
-
 Ethiopia
-
 Finland
-
 France
-
 Georgia
-
 Germany
-
 Ghana
-
 Greece
-
 Haiti
-
 Hong Kong
-
 Hungary
-
 India
-
 Indonesia
-
 Iran, Islamic republic
-
 Iraq
-
 Ireland
-
 Israel
-
 Italy
-
 Jamaica
-
 Japan
-
 Jordan
-
 Kazakhstan
-
 Kenya
-
 Korea
-
 Kuwait
-
 Kyrgyzstan
-
 Laos
-
 Latvia
-
 Lebanon
-
 Lesotho
-
 Libya
-
 Lithuania
-
 Luxembourg
-
 Madagascar
-
 Malaysia
-
 Malta
-
 Mauritius
-
 Mexico
-
 Moldova
-
 Mongolia
-
 Montenegro
-
 Morocco
-
 Mozambique
-
 Myanmar
-
 Namibia
-
 Nepal
-
 Netherlands
-
 New Zealand
-
 Nigeria
-
 North Macedonia
-
 Norway
-
 Oman
-
 Pakistan
-
 Palestine
-
 Panama
-
 Papua New Guinea
-
 Paraguay
-
 Peru
-
 Philippines
-
 Poland
-
 Portugal
-
 Puerto Rico
-
 Qatar
-
 Reunion
-
 Romania
-
 Rwanda
-
 Saudi Arabia
-
 Serbia
-
 Singapore
-
 Slovakia
-
 Slovenia
-
 Somalia
-
 South Africa
-
 Spain
-
 Sri Lanka
-
 Sweden
-
 Switzerland
-
 Syria
-
 Taiwan
-
 Tajikistan
-
 Tanzania
-
 Thailand
-
 Trinidad and Tobago
-
 Tunisia
-
 Turkey
-
 UAE
-
 Uganda
-
 Ukraine
-
 United Kingdom
-
United States
-
 Uruguay
-
 Uzbekistan
-
 Venezuela
-
 Vietnam
-
 Yemen
-
 Zambia
-
 Zimbabwe
- Forex
- Crypto












