

Cadence Design Systems stock forecast: Buyer support fuels recovery outlook

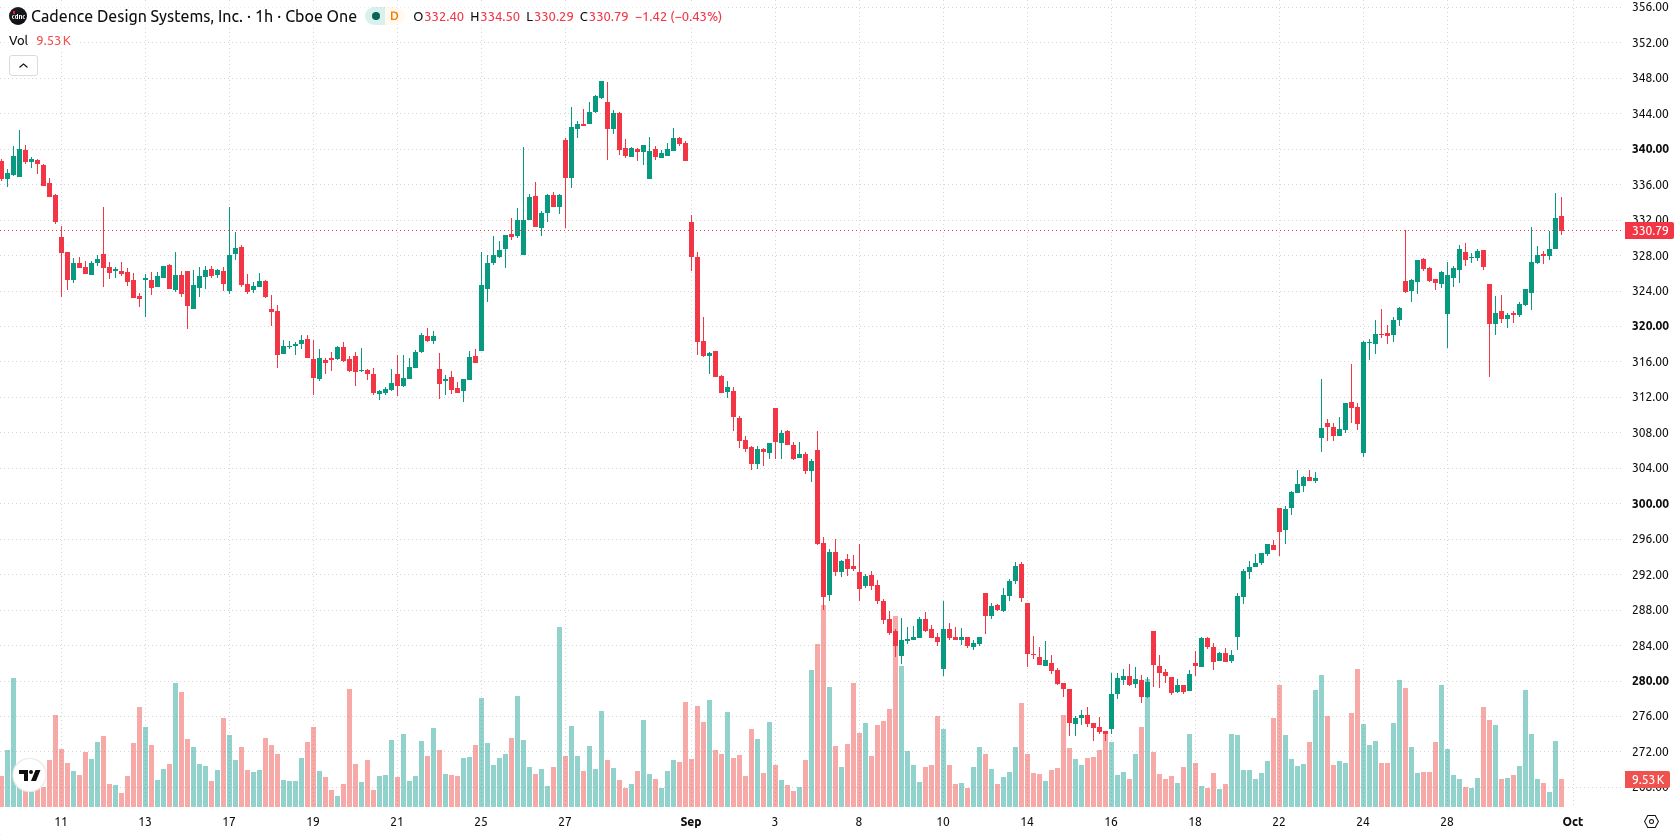
Cadence Design Systems (CDNS) stock is trading at $330.42, up 2.07% on the day. The price is positioned above its key moving averages, highlighting notable short-term and medium-term strength relative to trend metrics.
 337.98
348.75
Highlights
- ETFs sold $11.8 million worth of Cadence Design Systems shares on September 25, increasing the available float for trading.
- The ETF net selling is consistent with portfolio rebalancing or shifting sector allocations among institutional channels.
- Cadence Design Systems stock trades with strong short- and medium-term technical momentum, projected to move in the $319.41 to $341.43 range over the next 2 to 3 days.
ETF net selling increases float amid portfolio rebalancing
Institutional activity on September 25 showed ETFs reducing their holdings in Cadence Design Systems, with $11.8 million worth of shares sold, according to Gurufocus. This net selling by ETF channels increases the available float and often signals portfolio rebalancing or evolving sector allocation strategies among institutional investors. Despite the additional supply and potential sentiment effects from this ETF-driven move, current price action suggests robust demand from other market participants.
Momentum remains bullish despite overbought signals and support levels
On the technical front, CDNS is trading above the MA-20 and MA-50 on the working timeframe, and remains above the MA-200 on the daily chart. The Ichimoku Kijun at $323.39 sets immediate support for the session. Momentum signals are bullish, with the MACD on Strong Buy, ADX on Buy, and the Awesome Oscillator supporting the current uptrend. RSI reads 69.61, while CCI and Bull/Bear Power show overbought conditions, and the Stoch RSI remains Neutral — all indicating strong buyer dominance but with a risk of short-term exhaustion.
Neutral range forecast as volatility defines near-term direction
Looking ahead over the next 2–3 trading days, CDNS is expected to fluctuate within a volatility band between $319.41 and $341.43. The most probable scenario is a continuation of sideways price action inside this range. In a bullish breakout, gains may extend beyond the upper boundary, while a decline below the Ichimoku Kijun support at $323.39 could trigger corrective moves.
Earlier, analysts noted that Cadence Design Systems was exhibiting sustained bullish momentum despite technical resistance and potential overbought conditions. The latest market action, including continued strength above key moving averages and renewed institutional rebalancing, highlights $323.39 as a pivotal support level in the upcoming sessions for traders seeking confirmation of trend direction.






Latest Cadence Design Systems Inc News





-
 Afghanistan
-
 Albania
-
 Algeria
-
 Angola
-
 Argentina
-
 Armenia
-
 Australia
-
 Austria
-
 Azerbaijan
-
 Bahamas
-
 Bahrain
-
 Bangladesh
-
 Belarus
-
 Belgium
-
 Bolivia
-
 Botswana
-
 Brazil
-
 Brunei
-
 Bulgaria
-
 Cambodia
-
 Cameroon
-
 Canada
-
 Chile
-
 China
-
 Colombia
-
 Congo
-
 Costa Rica
-
 Cote d'Ivoire
-
 Croatia
-
 Cuba
-
 Cyprus
-
 Czechia
-
 DR Congo
-
 Denmark
-
 Dominican Republic
-
 Ecuador
-
 Egypt
-
 El Salvador
-
 Estonia
-
 Eswatini
-
 Ethiopia
-
 Finland
-
 France
-
 Georgia
-
 Germany
-
 Ghana
-
 Greece
-
 Haiti
-
 Hong Kong
-
 Hungary
-
 India
-
 Indonesia
-
 Iran, Islamic republic
-
 Iraq
-
 Ireland
-
 Israel
-
 Italy
-
 Jamaica
-
 Japan
-
 Jordan
-
 Kazakhstan
-
 Kenya
-
 Korea
-
 Kuwait
-
 Kyrgyzstan
-
 Laos
-
 Latvia
-
 Lebanon
-
 Lesotho
-
 Libya
-
 Lithuania
-
 Luxembourg
-
 Madagascar
-
 Malaysia
-
 Malta
-
 Mauritius
-
 Mexico
-
 Moldova
-
 Mongolia
-
 Montenegro
-
 Morocco
-
 Mozambique
-
 Myanmar
-
 Namibia
-
 Nepal
-
 Netherlands
-
 New Zealand
-
 Nigeria
-
 North Macedonia
-
 Norway
-
 Oman
-
 Pakistan
-
 Palestine
-
 Panama
-
 Papua New Guinea
-
 Paraguay
-
 Peru
-
 Philippines
-
 Poland
-
 Portugal
-
 Puerto Rico
-
 Qatar
-
 Reunion
-
 Romania
-
 Rwanda
-
 Saudi Arabia
-
 Serbia
-
 Singapore
-
 Slovakia
-
 Slovenia
-
 Somalia
-
 South Africa
-
 Spain
-
 Sri Lanka
-
 Sweden
-
 Switzerland
-
 Syria
-
 Taiwan
-
 Tajikistan
-
 Tanzania
-
 Thailand
-
 Trinidad and Tobago
-
 Tunisia
-
 Turkey
-
 UAE
-
 Uganda
-
 Ukraine
-
 United Kingdom
-
United States
-
 Uruguay
-
 Uzbekistan
-
 Venezuela
-
 Vietnam
-
 Yemen
-
 Zambia
-
 Zimbabwe
- Forex
- Crypto












