

Will Novo Nordisk stock hold $37.46 support as sellers control momentum?

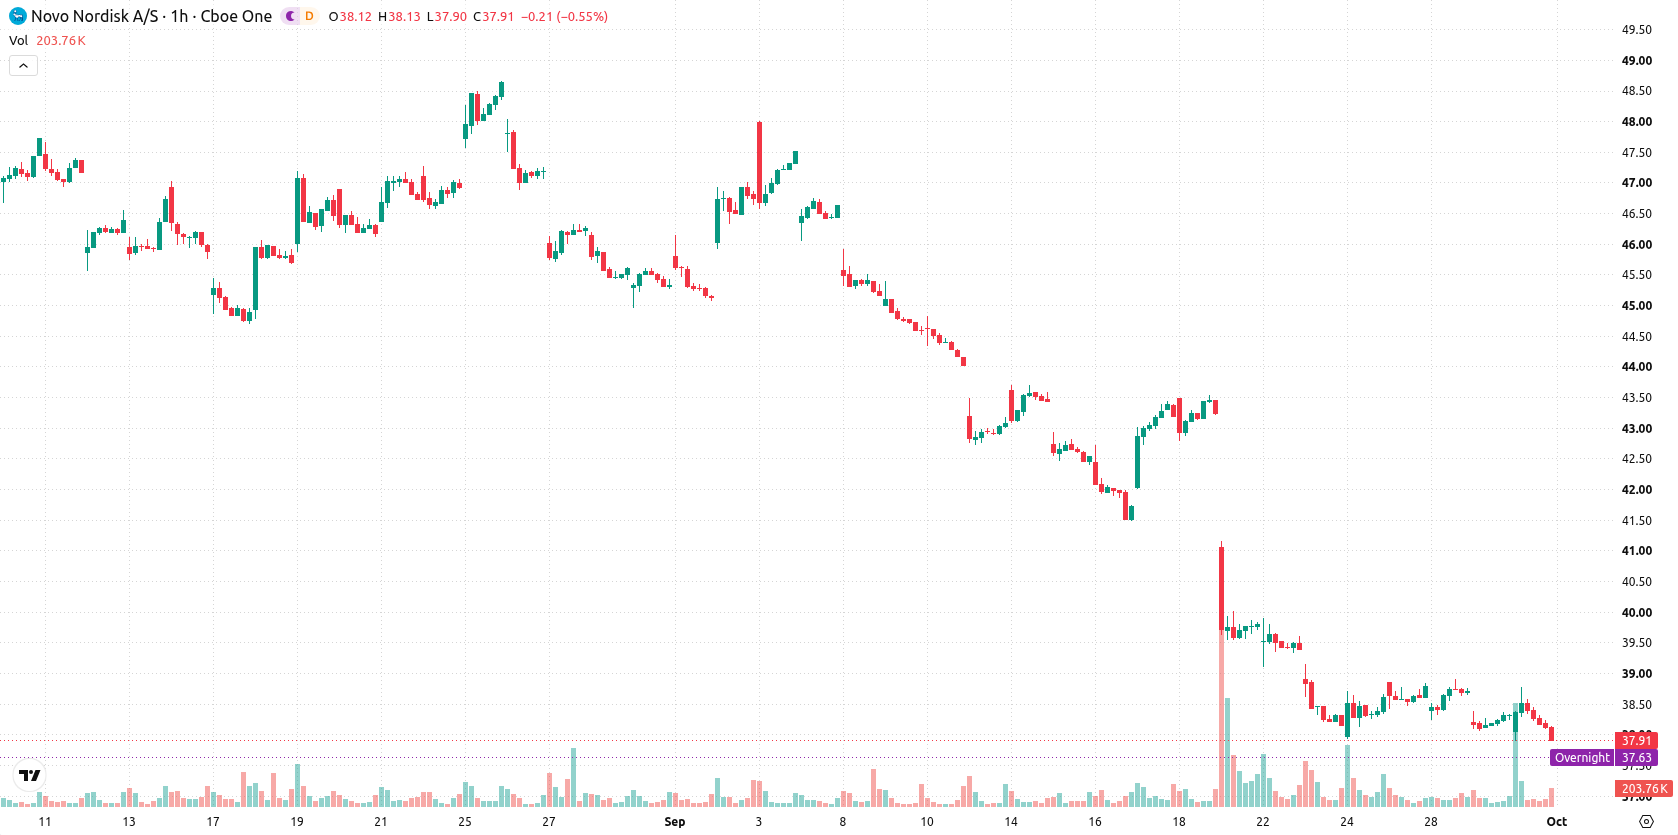
Novo Nordisk (NVO) stock is trading at $37.91, marking a daily decline of 1.06%. The price remains below its short-, medium-, and long-term moving averages, highlighting persistent negative momentum.
 38.53
38.68
38.53
38.68
Highlights
- Novo Nordisk reported real-world data showing reduced cardiovascular risk when escalating semaglutide dose versus switching to tirzepatide.
- Novo Nordisk secured global rights to HRS-1596 outside greater China in a deal valued up to $2.6 billion.
- Shares of Novo Nordisk closed at $37.91 with sustained bearish momentum and are expected to trade between $37.46 to $38.36 in the near term.
Pipeline expansion and positive trial data met with selling pressure
Novo Nordisk published new real-world evidence highlighting that increasing the dose of semaglutide led to a reduction in major adverse cardiovascular events compared to switching to Eli Lilly's tirzepatide, according to Benzinga. The company also secured global rights to HRS-1596 outside of greater China in a deal valued up to $2.6 billion, which expands its pipeline and international reach, as reported by Benzinga. Additionally, Novo Nordisk presented analysis at the European diabetes meeting in Milan showing adults with type 2 diabetes experienced a 6% lower relative risk of adverse outcomes when increasing their Ozempic dosage versus switching to Mounjaro, based on a Novo-funded study noted by Medicaldaily. These developments underscore Novo Nordisk's active product and clinical strategy, though price action has remained under broader selling pressure.
Multiple sell signals as NVO tests oversold technical boundaries
On the hourly chart, NVO is positioned below the MA-20 at $38.36 and MA-50 at $38.56, while on the daily chart it remains below the MA-200 at $45.78. The Ichimoku Kijun at $38.39 stands as immediate resistance. MACD and ADX both align with sell momentum, while the RSI registers at 32.17 (Sell), and both Stoch RSI and CCI are in oversold territory. Bull/Bear Power further indicates intraday selling advantage, with the Awesome Oscillator remaining neutral and not confirming the prevailing downside.
Range-bound trading expected as breakout risk remains subdued
In the coming days, NVO is likely to trade within the $37.46–$38.36 range, as current momentum suggests continued containment within this band. The probability of an upward rebound remains low unless a breakout above the $38.39 resistance occurs, while downside risk is notably higher if support at $37.46 is breached. Under typical volatility, the baseline expectation is for price to remain range-bound, with any move through these technical levels potentially establishing a fresh directional bias.
Earlier, analysts noted that Novo Nordisk was contending with persistent technical weakness despite notable advances in its pipeline and clinical portfolio. The current article strengthens this view, as recent strategic developments have yet to shift momentum, making the $38.39 resistance level a critical threshold to monitor for signs of trend reversal in the near term.





Latest Novo Nordisk News





-
 Afghanistan
-
 Albania
-
 Algeria
-
 Angola
-
 Argentina
-
 Armenia
-
 Australia
-
 Austria
-
 Azerbaijan
-
 Bahamas
-
 Bahrain
-
 Bangladesh
-
 Belarus
-
 Belgium
-
 Bolivia
-
 Botswana
-
 Brazil
-
 Brunei
-
 Bulgaria
-
 Cambodia
-
 Cameroon
-
 Canada
-
 Chile
Chile
-
 China
China
-
 Colombia
-
 Congo
Congo
-
 Costa Rica
-
 Cote d'Ivoire
-
 Croatia
-
 Cuba
Cuba
-
 Cyprus
-
 Czechia
-
 DR Congo
-
 Denmark
-
 Dominican Republic
-
 Ecuador
-
 Egypt
Egypt
-
 El Salvador
-
 Estonia
-
 Eswatini
-
 Ethiopia
-
 Finland
-
 France
-
 Georgia
-
 Germany
-
 Ghana
Ghana
-
 Greece
-
 Haiti
Haiti
-
 Hong Kong
-
 Hungary
-
 India
India
-
 Indonesia
-
 Iran, Islamic republic
-
 Iraq
Iraq
-
 Ireland
-
 Israel
-
 Italy
Italy
-
 Jamaica
-
 Japan
Japan
-
 Jordan
-
 Kazakhstan
-
 Kenya
Kenya
-
 Korea
Korea
-
 Kuwait
-
 Kyrgyzstan
-
 Laos
Laos
-
 Latvia
-
 Lebanon
-
 Lesotho
-
 Libya
Libya
-
 Lithuania
-
 Luxembourg
-
 Madagascar
-
 Malaysia
-
 Malta
Malta
-
 Mauritius
-
 Mexico
-
 Moldova
-
 Mongolia
-
 Montenegro
-
 Morocco
-
 Mozambique
-
 Myanmar
-
 Namibia
-
 Nepal
Nepal
-
 Netherlands
-
 New Zealand
-
 Nigeria
-
 North Macedonia
-
 Norway
-
 Oman
Oman
-
 Pakistan
-
 Palestine
-
 Panama
-
 Papua New Guinea
-
 Paraguay
-
 Peru
Peru
-
 Philippines
-
 Poland
-
 Portugal
-
 Puerto Rico
-
 Qatar
Qatar
-
 Reunion
-
 Romania
-
 Rwanda
-
 Saudi Arabia
-
 Serbia
-
 Singapore
-
 Slovakia
-
 Slovenia
-
 Somalia
-
 South Africa
-
 Spain
Spain
-
 Sri Lanka
-
 Sweden
-
 Switzerland
-
 Syria
Syria
-
 Taiwan
-
 Tajikistan
-
 Tanzania
-
 Thailand
-
 Trinidad and Tobago
-
 Tunisia
-
 Turkey
-
 UAE
UAE
-
 Uganda
-
 Ukraine
-
 United Kingdom
-
United States
-
 Uruguay
-
 Uzbekistan
-
 Venezuela
-
 Vietnam
-
 Yemen
Yemen
-
 Zambia
-
 Zimbabwe
- Forex
- Crypto












