

Disney shares weekly forecast: Sideways trend holds with oscillators stuck in neutral zones

Shares of The Walt Disney Company (DIS) are trading near $102 after sliding more than 3% over the past week, as rebound odds remain limited. Ongoing restructuring and cost controls continue to shape sentiment into the new week.
 113.78
111.88
Highlights
- Shares of Disney fell 3.6% over the past week to $102.14, closing near the bottom of the recent trading range.
- The stock currently trades below all key daily moving averages, indicating a loss of short-term momentum despite a neutral long-term trend.
- Disney stock is expected to consolidate in a narrow $101.2 to $103.07 range with a very low probability of a breakdown.
Cost cuts and mixed headlines drive uncertainty as new CEO pivots strategy
DIS announced around September 29, 2026, that it will lay off roughly 300 employees in human resources and technology, extending its cost-reduction strategy under new CEO Josh D'Amaro. CNBC noted that DIS also raised its 2026 share buyback target to at least $9 billion, signaling commitment to shareholder returns. A drop in third-quarter segment operating income due to early NBA playoff exits and a network dispute, as well as a pause in DIS's antitrust suit against InterDigital by a Delaware federal judge, add further uncertainty for the week ahead.
Neutral technical signals dominate as resistance at MA-200 caps momentum
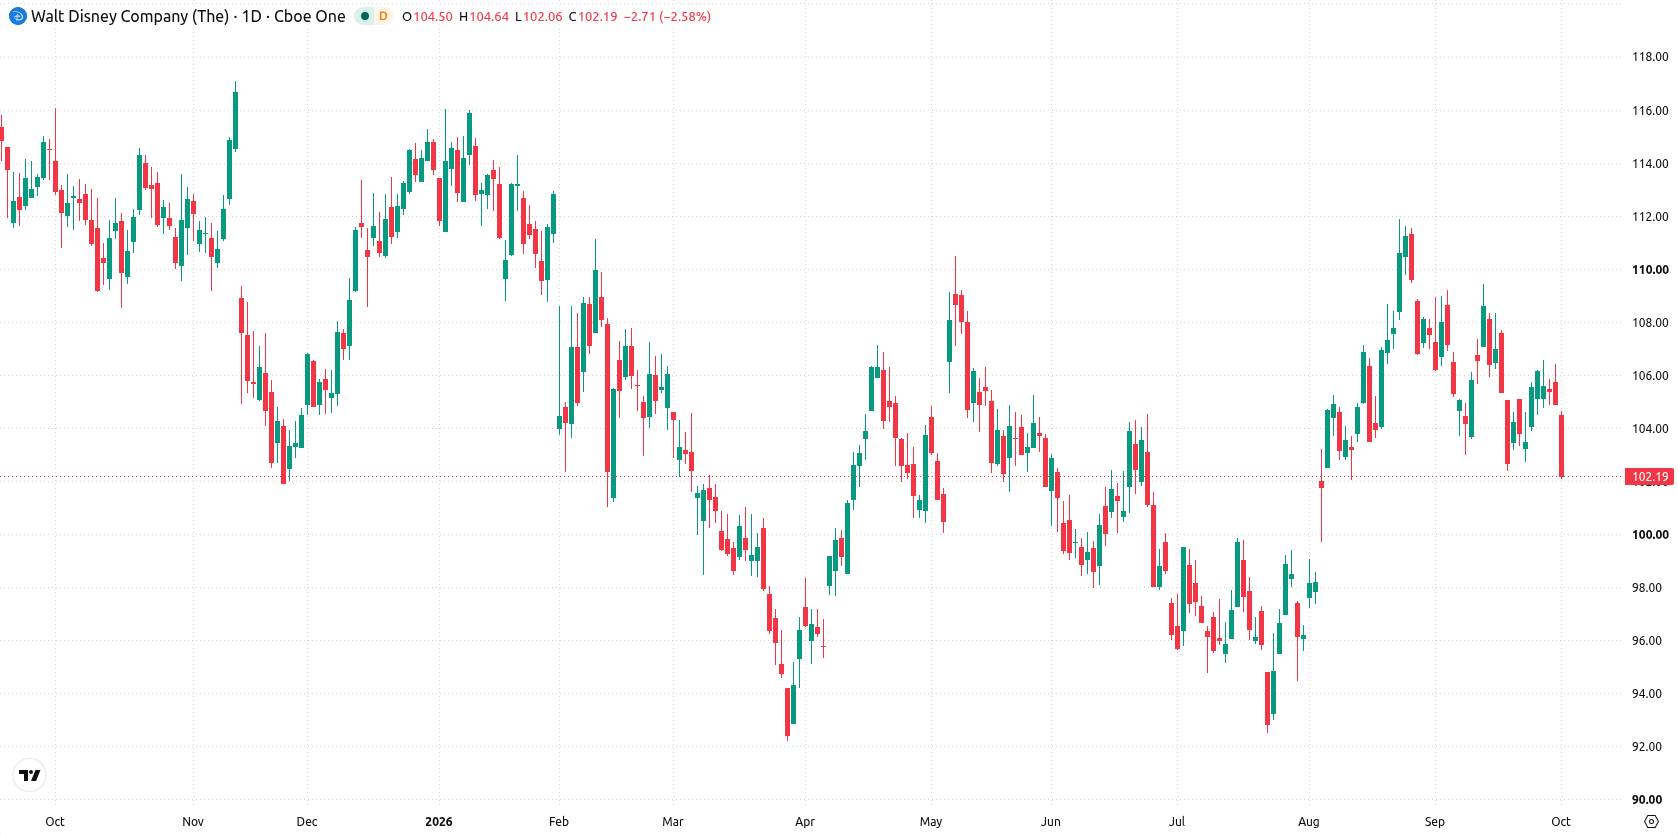
The daily chart currently presents a flat trend, with price contained beneath resistance at the MA-200 ($103.94). Most oscillators, including RSI at 49.15 and CCI at -10.9, remain in neutral zones, signaling a lack of clear directional bias. Volatility over the past week registered at 1.99%, and momentum signals are mixed, with Bull/Bear Power indicating overbought conditions while trend indicators such as MACD and ADX remain neutral. The nearest resistance is set at $103.94 from the MA-200, and the daily Ichimoku Kijun at $107 acts as a further cap.
Narrow consolidation likely as breakout odds remain limited for next week
Over the next five trading days, Disney stock is expected to consolidate within a narrow band between $101.2 and $103.07. There is a very high probability (more than 80%) of prices holding or rebounding, and a very low probability (less than 20%) of a breakdown. The base case sees the stock fluctuating inside this range; a push above $103.94 could open up a move toward the $107 Kijun resistance, while any close below $101.2 would signal a risk of further downside.
Earlier, analysts noted that Disney’s ongoing restructuring and integration efforts under its new leadership were aimed at restoring sustainable growth but continued to face skepticism regarding their effectiveness. With the stock now trading just above $102, traders should closely monitor the $103.94 resistance and $101.2 support levels for potential short-term breakout or breakdown signals.











-
 Afghanistan
-
 Albania
-
 Algeria
-
 Angola
-
 Argentina
-
 Armenia
-
 Australia
-
 Austria
-
 Azerbaijan
-
 Bahamas
-
 Bahrain
-
 Bangladesh
-
 Belarus
-
 Belgium
-
 Bolivia
-
 Botswana
-
 Brazil
-
 Brunei
-
 Bulgaria
-
 Cambodia
-
 Cameroon
-
 Canada
-
 Chile
-
 China
-
 Colombia
-
 Congo
-
 Costa Rica
-
 Cote d'Ivoire
-
 Croatia
-
 Cuba
-
 Cyprus
-
 Czechia
-
 DR Congo
-
 Denmark
-
 Dominican Republic
-
 Ecuador
-
 Egypt
-
 El Salvador
-
 Estonia
-
 Eswatini
-
 Ethiopia
-
 Finland
-
 France
-
 Georgia
-
 Germany
-
 Ghana
-
 Greece
-
 Haiti
-
 Hong Kong
-
 Hungary
-
 India
-
 Indonesia
-
 Iran, Islamic republic
-
 Iraq
-
 Ireland
-
 Israel
-
 Italy
-
 Jamaica
-
 Japan
-
 Jordan
-
 Kazakhstan
-
 Kenya
-
 Korea
-
 Kuwait
-
 Kyrgyzstan
-
 Laos
-
 Latvia
-
 Lebanon
-
 Lesotho
-
 Libya
-
 Lithuania
-
 Luxembourg
-
 Madagascar
-
 Malaysia
-
 Malta
-
 Mauritius
-
 Mexico
-
 Moldova
-
 Mongolia
-
 Montenegro
-
 Morocco
-
 Mozambique
-
 Myanmar
-
 Namibia
-
 Nepal
-
 Netherlands
-
 New Zealand
-
 Nigeria
-
 North Macedonia
-
 Norway
-
 Oman
-
 Pakistan
-
 Palestine
-
 Panama
-
 Papua New Guinea
-
 Paraguay
-
 Peru
-
 Philippines
-
 Poland
-
 Portugal
-
 Puerto Rico
-
 Qatar
-
 Reunion
-
 Romania
-
 Rwanda
-
 Saudi Arabia
-
 Serbia
-
 Singapore
-
 Slovakia
-
 Slovenia
-
 Somalia
-
 South Africa
-
 Spain
-
 Sri Lanka
-
 Sweden
-
 Switzerland
-
 Syria
-
 Taiwan
-
 Tajikistan
-
 Tanzania
-
 Thailand
-
 Trinidad and Tobago
-
 Tunisia
-
 Turkey
-
 UAE
-
 Uganda
-
 Ukraine
-
 United Kingdom
-
United States
-
 Uruguay
-
 Uzbekistan
-
 Venezuela
-
 Vietnam
-
 Yemen
-
 Zambia
-
 Zimbabwe
- Forex
- Crypto












