

Novus AI storage architecture launch: NTAP technical outlook

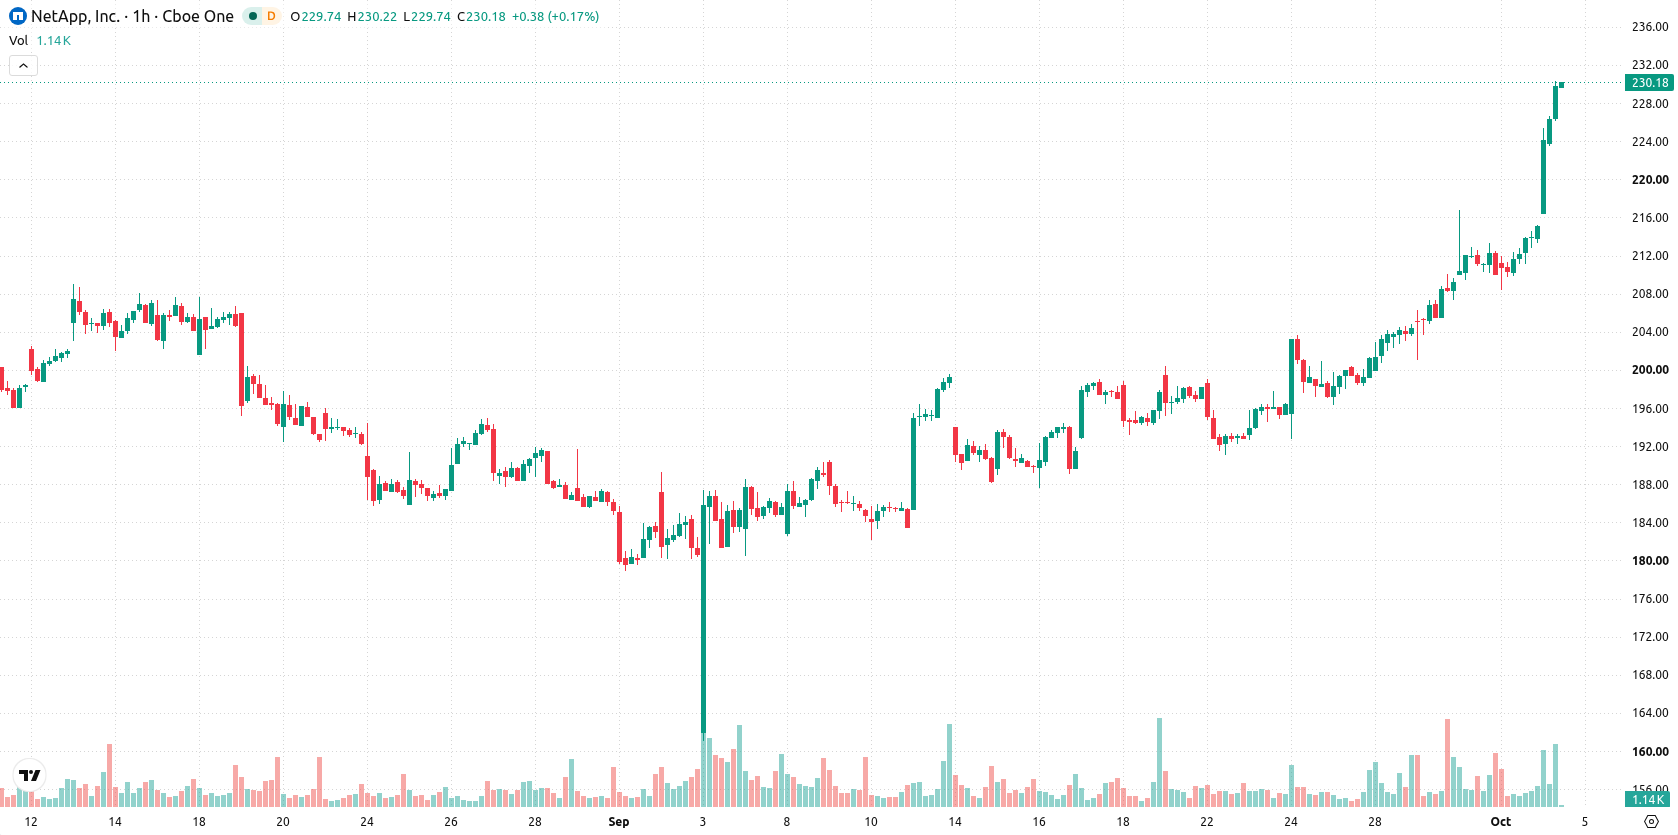
NetApp (NTAP) stock is trading at $229.74 after a 6.83% gain for the day, closing near the session's high and demonstrating strong upward momentum. The price holds well above its key moving averages and remains in bullish territory across the short, medium, and long term.
 200.50
231.49
Highlights
- NetApp CEO George Kurian sold 50,000 shares for $10,497,500, drawing attention to insider actions and company valuation.
- NetApp introduced the Novus AI storage architecture and expanded partnerships with Oracle, Supermicro, and SAP to increase its presence in the AI and cloud storage markets.
- Shares of NetApp surged 6.83% to $229.74, with technicals showing strong upside momentum and a projected short-term range of $222.5 to $237.82.
Insider sale and AI initiatives shift focus to valuation and growth
The most material recent event is Netapp CEO George Kurian's sale of 50,000 shares on September 29, 2026, for a total value of $10,497,500, as reported by MarketBeat; this large insider transaction can draw market focus to the company's valuation and signal executive confidence in portfolio strategy while also increasing liquidity. NetApp also launched the Novus high-scale AI storage architecture to address GPU bottlenecks in large-scale AI systems, a move that enhances its positioning in the growing AI infrastructure market. In addition, expanded partnerships with Oracle, Supermicro, and SAP further extend NetApp's reach within the AI and cloud storage space, while the recognition of top performers at the 2026 North America Partner Awards underscores continued momentum in its sales ecosystem.
Bullish momentum confirmed as NTAP trades above key supports
Technically, NTAP has established firm support at the Ichimoku Kijun level of $213.13, while trading well above the MA-20 at $212.41, the MA-50 at $205.17, and the long-term MA-200 at $138. Momentum indicators reinforce the bullish setup: MACD and ADX both confirm a strong uptrend, and the RSI reads a deeply overbought 86.57. Stoch RSI, CCI, and Bull/Bear Power all remain in overbought or strong buyer-dominance zones, whereas the Awesome Oscillator continues to support the upward price move with no sign of bearish divergence.
Further gains likely as upside probability outweighs downside risk
In the short term, NTAP is likely to trade in the range of $222.5 to $237.82. The probability of further upside remains high at 79%, with a less likely 21% probability of decline. If the price consolidates, expect sideways action within this typical volatility band, while a breakout above range highs could trigger accelerated gains; conversely, a drop below immediate support at $213.13 would threaten the persistence of recent advances.
Previously, it was reported that analysts viewed NetApp as maintaining a strong fundamental position, recommending a continued hold on the stock. The latest technical and fundamental developments, including new AI initiatives and robust price momentum, suggest traders should closely monitor for a breakout above the current resistance band, with persistent overbought conditions presenting both potential for further gains and heightened reversal risk.










-
 Afghanistan
-
 Albania
-
 Algeria
-
 Angola
-
 Argentina
-
 Armenia
-
 Australia
-
 Austria
-
 Azerbaijan
-
 Bahamas
-
 Bahrain
-
 Bangladesh
-
 Belarus
-
 Belgium
-
 Bolivia
-
 Botswana
-
 Brazil
-
 Brunei
-
 Bulgaria
-
 Cambodia
-
 Cameroon
-
 Canada
-
 Chile
-
 China
-
 Colombia
-
 Congo
-
 Costa Rica
-
 Cote d'Ivoire
-
 Croatia
-
 Cuba
-
 Cyprus
-
 Czechia
-
 DR Congo
-
 Denmark
-
 Dominican Republic
-
 Ecuador
-
 Egypt
-
 El Salvador
-
 Estonia
-
 Eswatini
-
 Ethiopia
-
 Finland
-
 France
-
 Georgia
-
 Germany
-
 Ghana
-
 Greece
-
 Haiti
-
 Hong Kong
-
 Hungary
-
 India
-
 Indonesia
-
 Iran, Islamic republic
-
 Iraq
-
 Ireland
-
 Israel
-
 Italy
-
 Jamaica
-
 Japan
-
 Jordan
-
 Kazakhstan
-
 Kenya
-
 Korea
-
 Kuwait
-
 Kyrgyzstan
-
 Laos
-
 Latvia
-
 Lebanon
-
 Lesotho
-
 Libya
-
 Lithuania
-
 Luxembourg
-
 Madagascar
-
 Malaysia
-
 Malta
-
 Mauritius
-
 Mexico
-
 Moldova
-
 Mongolia
-
 Montenegro
-
 Morocco
-
 Mozambique
-
 Myanmar
-
 Namibia
-
 Nepal
-
 Netherlands
-
 New Zealand
-
 Nigeria
-
 North Macedonia
-
 Norway
-
 Oman
-
 Pakistan
-
 Palestine
-
 Panama
-
 Papua New Guinea
-
 Paraguay
-
 Peru
-
 Philippines
-
 Poland
-
 Portugal
-
 Puerto Rico
-
 Qatar
-
 Reunion
-
 Romania
-
 Rwanda
-
 Saudi Arabia
-
 Serbia
-
 Singapore
-
 Slovakia
-
 Slovenia
-
 Somalia
-
 South Africa
-
 Spain
-
 Sri Lanka
-
 Sweden
-
 Switzerland
-
 Syria
-
 Taiwan
-
 Tajikistan
-
 Tanzania
-
 Thailand
-
 Trinidad and Tobago
-
 Tunisia
-
 Turkey
-
 UAE
-
 Uganda
-
 Ukraine
-
 United Kingdom
-
United States
-
 Uruguay
-
 Uzbekistan
-
 Venezuela
-
 Vietnam
-
 Yemen
-
 Zambia
-
 Zimbabwe
- Forex
- Crypto












