

Accenture stock slips below $199.86 support as intraday selling meets buy zone

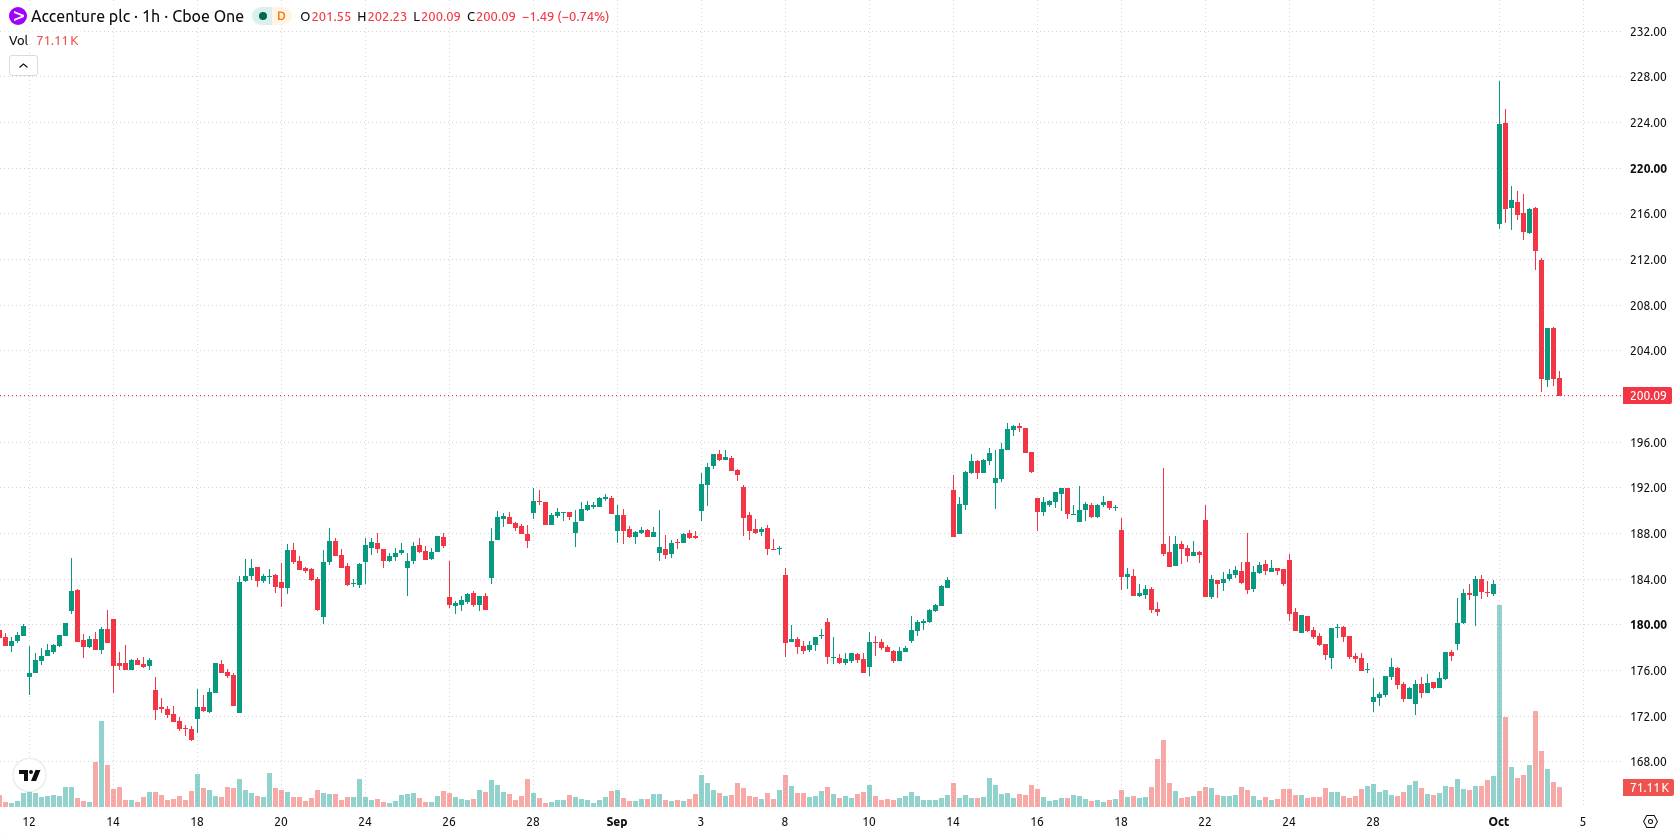
Accenture (ACN) stock is trading at $200.86 after slipping 5.39% for the day. The price finished the session above its short- and medium-term moving averages, but with pronounced intraday selling into support.
 247.43
252.00
Highlights
- Accenture reported fourth-quarter revenue of $18.7 billion and earnings per share of $3.29, both above analyst expectations.
- Record annual bookings reached $84.5 billion, with $11.5 billion returned to shareholders through buybacks and dividends and a 5% dividend increase.
- Shares of Accenture fell 5.39% to $200.86, with technical momentum mostly bullish; the expected price range is $176.18 to $225.54 for the next several days.
Beating forecasts and strategic AI investments contrast with bearish price action
Accenture reported fourth-quarter revenue of $18.7 billion and earnings per share of $3.29, both surpassing analyst expectations, according to Finance Yahoo. Strong performance over the past year included record annual bookings of $84.5 billion and $11.5 billion returned to shareholders through repurchases and dividends, accompanied by a 5% increase in the quarterly payout and substantial managed services contract wins in Q4, as highlighted by Gurufocus. The company also moved to double its AI and data workforce and launched 'Accenture Construct' to consolidate capital projects operations, while jointly committing over $1 billion with Anthropic to AI safety initiatives—though price action has remained under broader selling pressure.
Buyer momentum holds amid mixed oscillators and near-term support
Technically, ACN closed above the hourly MA-20 at $194.08 and MA-50 at $184.88, as well as above the daily MA-200 at $196.31. The Ichimoku Kijun on the daily chart provides immediate support at $199.86. On the hourly chart, momentum indicators signal mixed yet buyer-favored conditions: MACD and ADX both indicate a Buy, RSI is elevated at 61.48, and CCI aligns with a Buy reading. Stochastic RSI is oversold, but Bull/Bear Power points to an overbought state, indicating that although buyers have maintained control, recent oscillators reflect short-term volatility and caution.
Sideways-to-upward bias dominates as reversal risk remains subdued
Over the coming days, ACN is likely to stay within the $176.18 to $225.54 volatility band relative to current levels. Scenario analysis implies a 68% likelihood of sideways-to-upward movement versus 32% for a downside break, making a downward reversal the less probable outcome. A bullish breakout scenario would see price advancing to new resistance above the stated range, while a breach of the $199.86 support could trigger additional selling toward the lower end.
Previously it was reported that Accenture’s robust earnings outperformance and operational momentum positioned the stock favorably from both a technical and fundamental perspective. The current analysis adds nuance by highlighting increased short-term volatility despite continued support at key technical levels, making the $199.86 area a crucial threshold for traders monitoring near-term direction.






Latest Accenture News





-
 Afghanistan
-
 Albania
-
 Algeria
-
 Angola
-
 Argentina
-
 Armenia
-
 Australia
-
 Austria
-
 Azerbaijan
-
 Bahamas
-
 Bahrain
-
 Bangladesh
-
 Belarus
-
 Belgium
-
 Bolivia
-
 Botswana
-
 Brazil
-
 Brunei
-
 Bulgaria
-
 Cambodia
-
 Cameroon
-
 Canada
-
 Chile
-
 China
-
 Colombia
-
 Congo
-
 Costa Rica
-
 Cote d'Ivoire
-
 Croatia
-
 Cuba
-
 Cyprus
-
 Czechia
-
 DR Congo
-
 Denmark
-
 Dominican Republic
-
 Ecuador
-
 Egypt
-
 El Salvador
-
 Estonia
-
 Eswatini
-
 Ethiopia
-
 Finland
-
 France
-
 Georgia
-
 Germany
-
 Ghana
-
 Greece
-
 Haiti
-
 Hong Kong
-
 Hungary
-
 India
-
 Indonesia
-
 Iran, Islamic republic
-
 Iraq
-
 Ireland
-
 Israel
-
 Italy
-
 Jamaica
-
 Japan
-
 Jordan
-
 Kazakhstan
-
 Kenya
-
 Korea
-
 Kuwait
-
 Kyrgyzstan
-
 Laos
-
 Latvia
-
 Lebanon
-
 Lesotho
-
 Libya
-
 Lithuania
-
 Luxembourg
-
 Madagascar
-
 Malaysia
-
 Malta
-
 Mauritius
-
 Mexico
-
 Moldova
-
 Mongolia
-
 Montenegro
-
 Morocco
-
 Mozambique
-
 Myanmar
-
 Namibia
-
 Nepal
-
 Netherlands
-
 New Zealand
-
 Nigeria
-
 North Macedonia
-
 Norway
-
 Oman
-
 Pakistan
-
 Palestine
-
 Panama
-
 Papua New Guinea
-
 Paraguay
-
 Peru
-
 Philippines
-
 Poland
-
 Portugal
-
 Puerto Rico
-
 Qatar
-
 Reunion
-
 Romania
-
 Rwanda
-
 Saudi Arabia
-
 Serbia
-
 Singapore
-
 Slovakia
-
 Slovenia
-
 Somalia
-
 South Africa
-
 Spain
-
 Sri Lanka
-
 Sweden
-
 Switzerland
-
 Syria
-
 Taiwan
-
 Tajikistan
-
 Tanzania
-
 Thailand
-
 Trinidad and Tobago
-
 Tunisia
-
 Turkey
-
 UAE
-
 Uganda
-
 Ukraine
-
 United Kingdom
-
United States
-
 Uruguay
-
 Uzbekistan
-
 Venezuela
-
 Vietnam
-
 Yemen
-
 Zambia
-
 Zimbabwe
- Forex
- Crypto












