

FUTU slides nearly 4% as sellers dominate amid negative momentum readings

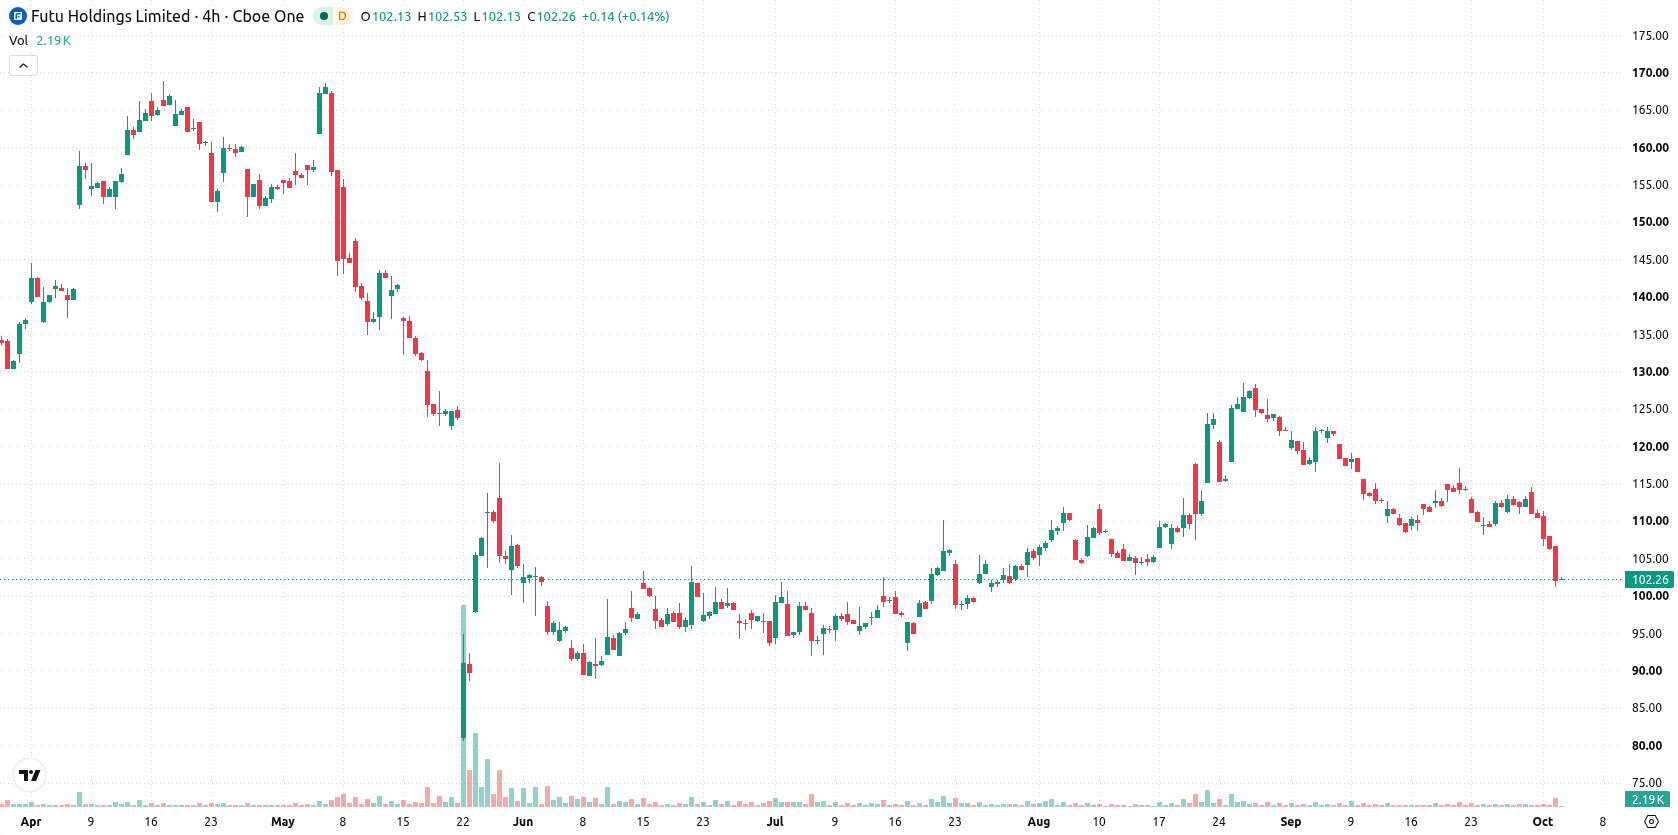
Futu Holdings Ltd. Sponsored ADR (FUTU) slid 3.69% on sustained selling pressure, as the stock continues to trade below key moving averages. This down move is supported by a firmly bearish technical structure, with resistance overhead and momentum readings confirming the sellers' control.
 99.77
106.98
Highlights
- Futu stock has drawn institutional attention as shares trade well below estimated intrinsic value despite recent earnings growth.
- Analysts expect potential earnings declines for Futu in the coming years, and the stock remains under broad selling pressure.
- Futu stock trades below key moving averages with negative momentum signals, a short-term expected range of $95.57 to $106.82, and a high probability of further downside.
Value gap draws institutions as earnings optimism competes with selling
Futu reported strong earnings growth recently, and its digital platform Futu NiuNiu continues to provide trading services in several major markets. Shares have been trading well below estimated intrinsic value, drawing attention from institutional investors. Market expectations, however, suggest possible earnings declines in the coming years, though price action has remained under broader selling pressure.
Oversold signals as sell momentum aligns with bearish boundaries
Futu is trading below its 20-day, 50-day, and 200-day moving averages ($112.97, $111.69, and $132.25, respectively), signaling persistent seller pressure across short-, medium-, and long-term trends. The nearest resistance is at $106.13 and the closest support is the session low at $101.29, with broader moving averages and the Ichimoku Kijun ($117.18) confirming a bearish trend context. Momentum indicators show weak to negative sentiment: the Moving Average Convergence Divergence (MACD) signals a sell, and the Average Directional Index (ADX) reads as neutral. The Relative Strength Index (RSI) is at 39.51 and the Commodity Channel Index (CCI) at -126.16, both flagging oversold conditions, which is echoed by the Stochastic RSI at 0 and the Bull/Bear Power (BBP) at -0.26, indicating sellers dominate intraday. Daily action saw the stock drop $3.93, or 3.69%, after a modest 0.16% upside gap, with the price currently near the low of the day. Intraday volatility stands at 5.46%. Price action is under pressure after the open, aligning with broadly negative momentum readings.
Earlier, analysts noted that Futu’s bullish momentum was tempered by longer-term technical resistance and mixed short-term signals. The current shift to firmly bearish technical conditions reinforces downside risk, with traders advised to monitor $95.57 as the pivotal support level in the coming sessions.






Latest Futu Holdings Ltd. Sponsored ADR News




-
 Afghanistan
-
 Albania
-
 Algeria
-
 Angola
-
 Argentina
-
 Armenia
-
 Australia
-
 Austria
-
 Azerbaijan
-
 Bahamas
-
 Bahrain
-
 Bangladesh
-
 Belarus
-
 Belgium
-
 Bolivia
-
 Botswana
-
 Brazil
-
 Brunei
-
 Bulgaria
-
 Cambodia
-
 Cameroon
-
 Canada
-
 Chile
-
 China
-
 Colombia
-
 Congo
-
 Costa Rica
-
 Cote d'Ivoire
-
 Croatia
-
 Cuba
-
 Cyprus
-
 Czechia
-
 DR Congo
-
 Denmark
-
 Dominican Republic
-
 Ecuador
-
 Egypt
-
 El Salvador
-
 Estonia
-
 Eswatini
-
 Ethiopia
-
 Finland
-
 France
-
 Georgia
-
 Germany
-
 Ghana
-
 Greece
-
 Haiti
-
 Hong Kong
-
 Hungary
-
 India
-
 Indonesia
-
 Iran, Islamic republic
-
 Iraq
-
 Ireland
-
 Israel
-
 Italy
-
 Jamaica
-
 Japan
-
 Jordan
-
 Kazakhstan
-
 Kenya
-
 Korea
-
 Kuwait
-
 Kyrgyzstan
-
 Laos
-
 Latvia
-
 Lebanon
-
 Lesotho
-
 Libya
-
 Lithuania
-
 Luxembourg
-
 Madagascar
-
 Malaysia
-
 Malta
-
 Mauritius
-
 Mexico
-
 Moldova
-
 Mongolia
-
 Montenegro
-
 Morocco
-
 Mozambique
-
 Myanmar
-
 Namibia
-
 Nepal
-
 Netherlands
-
 New Zealand
-
 Nigeria
-
 North Macedonia
-
 Norway
-
 Oman
-
 Pakistan
-
 Palestine
-
 Panama
-
 Papua New Guinea
-
 Paraguay
-
 Peru
-
 Philippines
-
 Poland
-
 Portugal
-
 Puerto Rico
-
 Qatar
-
 Reunion
-
 Romania
-
 Rwanda
-
 Saudi Arabia
-
 Serbia
-
 Singapore
-
 Slovakia
-
 Slovenia
-
 Somalia
-
 South Africa
-
 Spain
-
 Sri Lanka
-
 Sweden
-
 Switzerland
-
 Syria
-
 Taiwan
-
 Tajikistan
-
 Tanzania
-
 Thailand
-
 Trinidad and Tobago
-
 Tunisia
-
 Turkey
-
 UAE
-
 Uganda
-
 Ukraine
-
 United Kingdom
-
United States
-
 Uruguay
-
 Uzbekistan
-
 Venezuela
-
 Vietnam
-
 Yemen
-
 Zambia
-
 Zimbabwe
- Forex
- Crypto












