

Nano Dimension stock forecast: Buyer support keeps price in focus near resistance

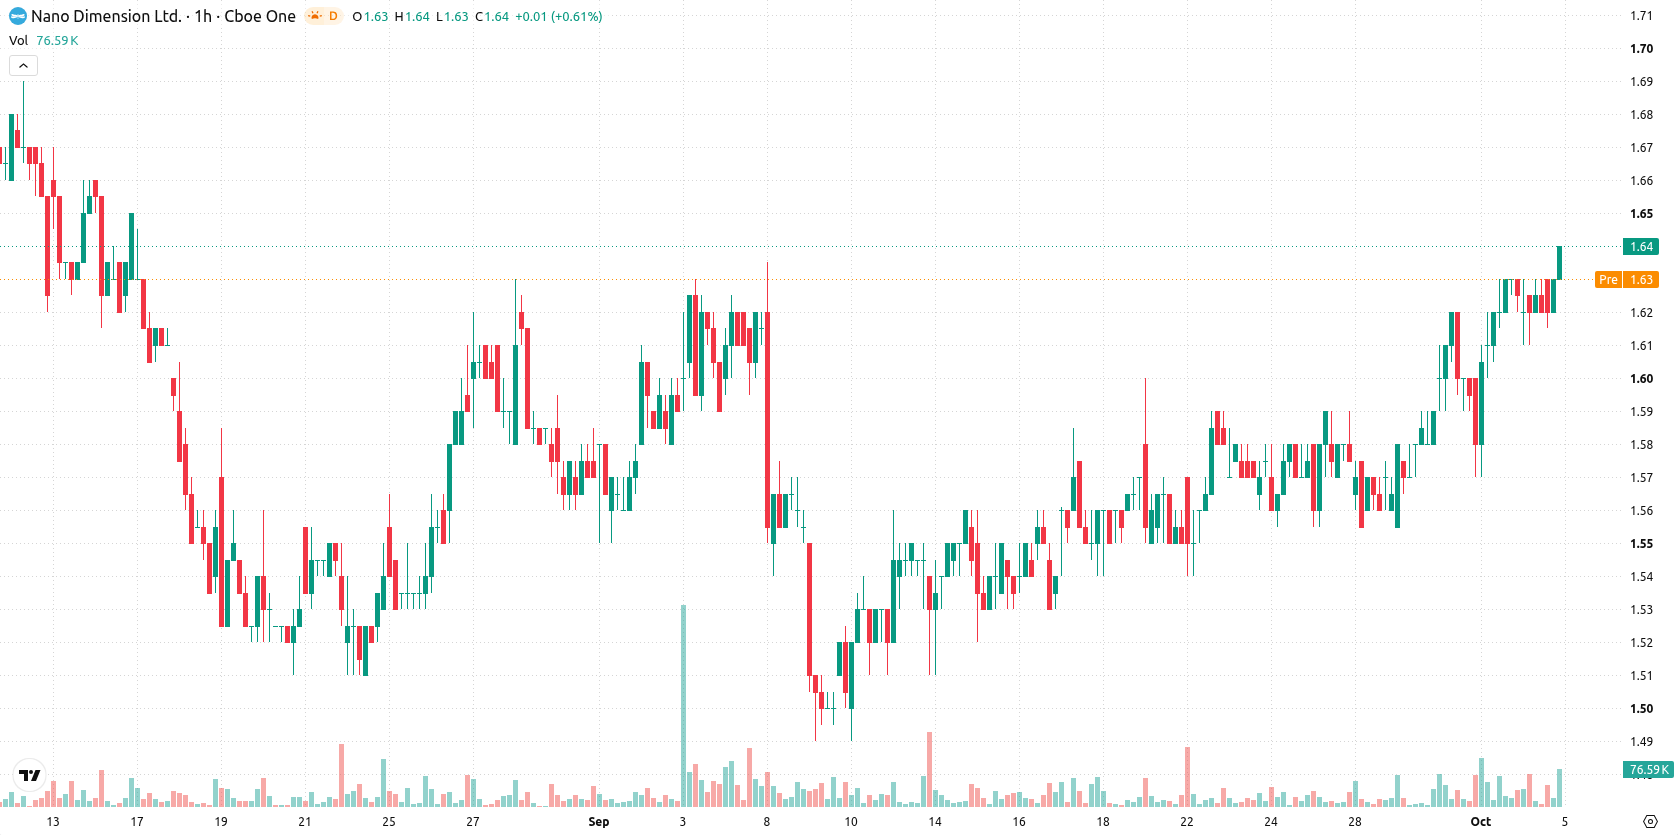
Nano Dimension (NNDM) stock is trading at $1.63, showing little change from the previous close. The price remains above its key moving averages, indicating a steady to mildly positive bias for the session.
 1.28
1.38
Highlights
- Shares of Nano Dimension display short- to medium-term bullish momentum with price above key short-term moving averages.
- Oscillators and momentum signals are mixed, with strong buying momentum present but overbought conditions appearing in short-term indicators.
- Price is forecasted to remain in the $1.59 to $1.67 range with a very high probability of sideways to upward movement and low reversal risk.
Mixed momentum as conflicting signals meet strong supports
On the hourly chart, price holds above the MA-20 at $1.62 and the MA-50 at $1.59, while still trading below the MA-200 on the daily timeframe at $1.66. The Ichimoku Kijun on the daily offers immediate support at $1.61. Momentum signals remain mixed: MACD reflects strong buying, Bull/Bear Power is strongly positive, but the ADX and Awesome Oscillator are neutral. Oscillators show mild bullishness with RSI at 60.5 and CCI in positive territory, yet Stoch RSI issues a strong sell signal, indicating potential short-term overbought risk. Price action for the session is near the high, with moderate volatility observed.
Sideways consolidation expected as breakout risk stays limited
In the short term, NNDM is expected to trade within a range of $1.59 to $1.67, consistent with recent volatility. The probability of upward movement is classified as very high, while the likelihood of a significant decline is very low. If resistance gives way, price could approach the $1.67 level; if support fails, a pullback toward $1.59 may occur. The baseline scenario remains sideways consolidation within the established band.
Earlier, analysts noted that Nano Dimension was demonstrating resilient short- and medium-term momentum while facing persistent longer-term resistance. The current analysis confirms this outlook with updated technical signals and highlights that sustained price stability above key moving averages continues to support the case for near-term consolidation while traders monitor for a shift in volatility or a decisive break above resistance.






Latest Nano Dimension News




-
 Afghanistan
-
 Albania
-
 Algeria
-
 Angola
-
 Argentina
-
 Armenia
-
 Australia
-
 Austria
-
 Azerbaijan
-
 Bahamas
-
 Bahrain
-
 Bangladesh
-
 Belarus
-
 Belgium
-
 Bolivia
-
 Botswana
-
 Brazil
-
 Brunei
-
 Bulgaria
-
 Cambodia
-
 Cameroon
-
 Canada
-
 Chile
-
 China
-
 Colombia
-
 Congo
-
 Costa Rica
-
 Cote d'Ivoire
-
 Croatia
-
 Cuba
-
 Cyprus
-
 Czechia
-
 DR Congo
-
 Denmark
-
 Dominican Republic
-
 Ecuador
-
 Egypt
-
 El Salvador
-
 Estonia
-
 Eswatini
-
 Ethiopia
-
 Finland
-
 France
-
 Georgia
-
 Germany
-
 Ghana
-
 Greece
-
 Haiti
-
 Hong Kong
-
 Hungary
-
 India
-
 Indonesia
-
 Iran, Islamic republic
-
 Iraq
-
 Ireland
-
 Israel
-
 Italy
-
 Jamaica
-
 Japan
-
 Jordan
-
 Kazakhstan
-
 Kenya
-
 Korea
-
 Kuwait
-
 Kyrgyzstan
-
 Laos
-
 Latvia
-
 Lebanon
-
 Lesotho
-
 Libya
-
 Lithuania
-
 Luxembourg
-
 Madagascar
-
 Malaysia
-
 Malta
-
 Mauritius
-
 Mexico
-
 Moldova
-
 Mongolia
-
 Montenegro
-
 Morocco
-
 Mozambique
-
 Myanmar
-
 Namibia
-
 Nepal
-
 Netherlands
-
 New Zealand
-
 Nigeria
-
 North Macedonia
-
 Norway
-
 Oman
-
 Pakistan
-
 Palestine
-
 Panama
-
 Papua New Guinea
-
 Paraguay
-
 Peru
-
 Philippines
-
 Poland
-
 Portugal
-
 Puerto Rico
-
 Qatar
-
 Reunion
-
 Romania
-
 Rwanda
-
 Saudi Arabia
-
 Serbia
-
 Singapore
-
 Slovakia
-
 Slovenia
-
 Somalia
-
 South Africa
-
 Spain
-
 Sri Lanka
-
 Sweden
-
 Switzerland
-
 Syria
-
 Taiwan
-
 Tajikistan
-
 Tanzania
-
 Thailand
-
 Trinidad and Tobago
-
 Tunisia
-
 Turkey
-
 UAE
-
 Uganda
-
 Ukraine
-
 United Kingdom
-
United States
-
 Uruguay
-
 Uzbekistan
-
 Venezuela
-
 Vietnam
-
 Yemen
-
 Zambia
-
 Zimbabwe
- Forex
- Crypto












