

Can Rolls-Royce stock extend gains as bullish momentum diverges from trend strength?

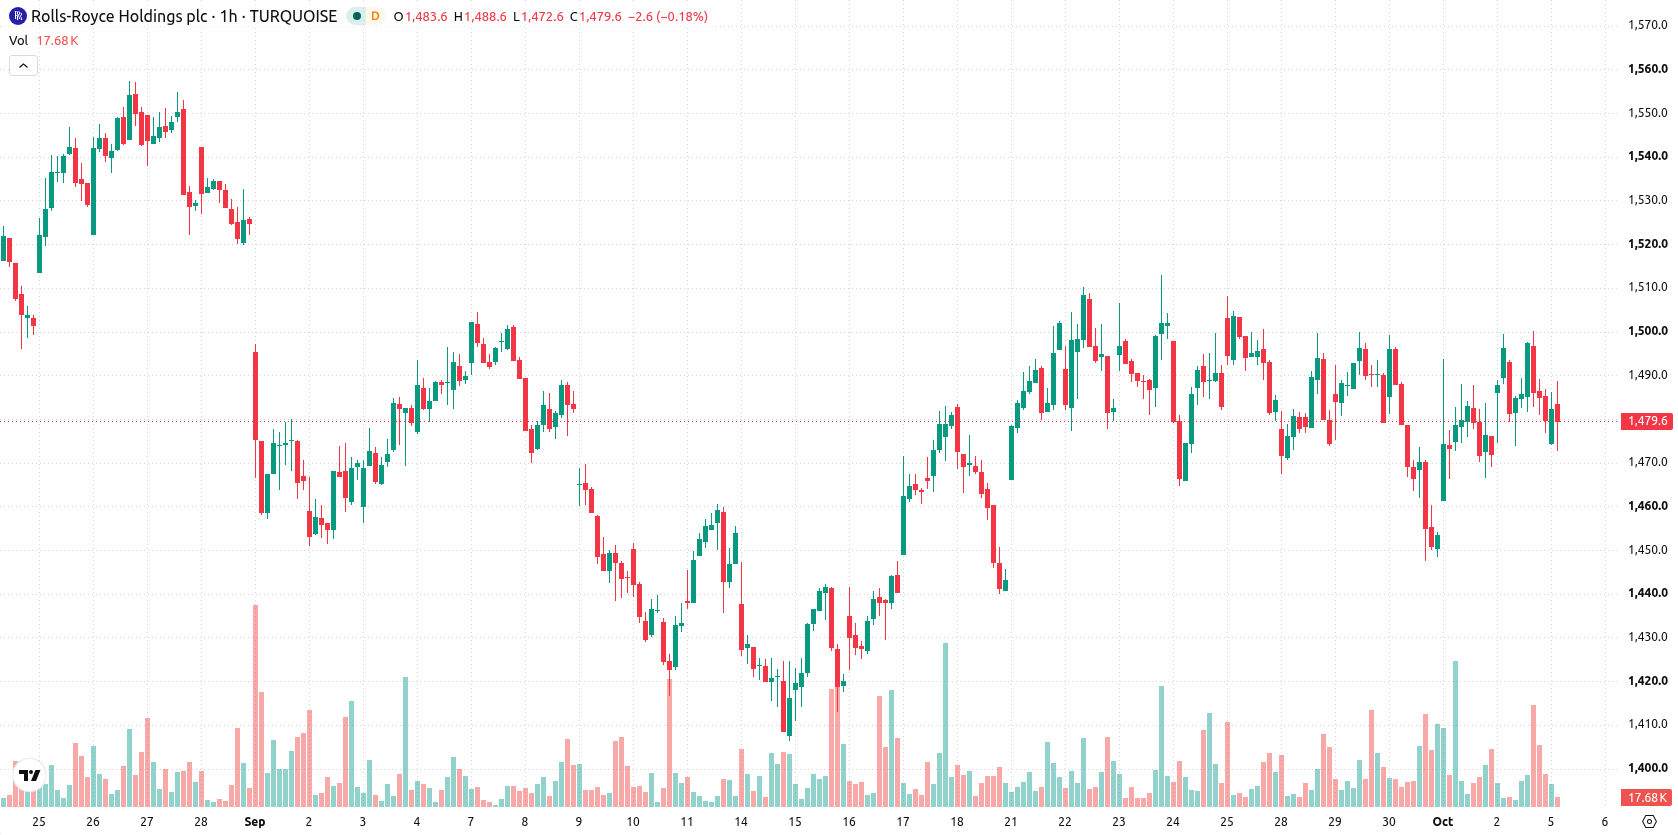
Rolls-Royce (RR) stock is trading at GBX1,480 with a modest daily rise. The price sits just below key short-term moving averages, but remains well above its longer-term average, reflecting a neutral to slightly supportive technical backdrop.
 1256.40
1289.40
Highlights
- Shares of Rolls-Royce are trading below key short- and medium-term moving averages but remain above the long-term uptrend line.
- Momentum indicators such as MACD and Stoch RSI suggest buy signals, though trend strength readings are neutral and intraday overbought conditions are present.
- Over the next 2 to 3 trading days, Rolls-Royce shares are projected to move between GBX1,457 and GBX1,503 with a 61% probability of a downward move.
Intraday buying strength amid technical mixed signals
The MA-20 and MA-50 on the H1 chart are clustered at GBX1,481, while the long-term MA-200 on the daily chart is positioned at GBX1,324. Immediate support is established by the Ichimoku Kijun level at GBX1,473. Momentum indicators on the H1 reveal MACD firmly in buy territory, with Stoch RSI also bullish, while RSI stands at 51.58 and signals a buy. The ADX and CCI both remain neutral, and Bull/Bear Power registers as overbought, reflecting dominant intraday buying but with little indication of a sustained trend. Daily price action shows subdued trading and low volatility, underscoring divergence between bullish oscillators and neutral trend signals.
Sideways bias as downside risk edges higher
Over the next two to three trading days, RR is expected to remain within a range of GBX1,457 to GBX1,503, reflecting typical volatility relative to current levels. Scenario probability leans 61% toward a short-term downside move, while the chance of an upward move is 39%. Baseline expectations call for sideways movement unless price closes decisively above resistance or falls below immediate support at GBX1,473.
Earlier, analysts noted that Rolls-Royce shares were consolidating above key support levels, creating the potential for a breakout from a range-bound pattern. The current analysis adds that, with momentum indicators divided and short-term volatility subdued, attention should now focus on whether support at GBX1,473 will hold against downside pressures in the days ahead.










-
 Afghanistan
-
 Albania
-
 Algeria
-
 Angola
-
 Argentina
-
 Armenia
-
 Australia
-
 Austria
-
 Azerbaijan
-
 Bahamas
-
 Bahrain
-
 Bangladesh
-
 Belarus
-
 Belgium
-
 Bolivia
-
 Botswana
-
 Brazil
-
 Brunei
-
 Bulgaria
-
 Cambodia
-
 Cameroon
-
 Canada
-
 Chile
-
 China
-
 Colombia
-
 Congo
-
 Costa Rica
-
 Cote d'Ivoire
-
 Croatia
-
 Cuba
-
 Cyprus
-
 Czechia
-
 DR Congo
-
 Denmark
-
 Dominican Republic
-
 Ecuador
-
 Egypt
-
 El Salvador
-
 Estonia
-
 Eswatini
-
 Ethiopia
-
 Finland
-
 France
-
 Georgia
-
 Germany
-
 Ghana
-
 Greece
-
 Haiti
-
 Hong Kong
-
 Hungary
-
 India
-
 Indonesia
-
 Iran, Islamic republic
-
 Iraq
-
 Ireland
-
 Israel
-
 Italy
-
 Jamaica
-
 Japan
-
 Jordan
-
 Kazakhstan
-
 Kenya
-
 Korea
-
 Kuwait
-
 Kyrgyzstan
-
 Laos
-
 Latvia
-
 Lebanon
-
 Lesotho
-
 Libya
-
 Lithuania
-
 Luxembourg
-
 Madagascar
-
 Malaysia
-
 Malta
-
 Mauritius
-
 Mexico
-
 Moldova
-
 Mongolia
-
 Montenegro
-
 Morocco
-
 Mozambique
-
 Myanmar
-
 Namibia
-
 Nepal
-
 Netherlands
-
 New Zealand
-
 Nigeria
-
 North Macedonia
-
 Norway
-
 Oman
-
 Pakistan
-
 Palestine
-
 Panama
-
 Papua New Guinea
-
 Paraguay
-
 Peru
-
 Philippines
-
 Poland
-
 Portugal
-
 Puerto Rico
-
 Qatar
-
 Reunion
-
 Romania
-
 Rwanda
-
 Saudi Arabia
-
 Serbia
-
 Singapore
-
 Slovakia
-
 Slovenia
-
 Somalia
-
 South Africa
-
 Spain
-
 Sri Lanka
-
 Sweden
-
 Switzerland
-
 Syria
-
 Taiwan
-
 Tajikistan
-
 Tanzania
-
 Thailand
-
 Trinidad and Tobago
-
 Tunisia
-
 Turkey
-
 UAE
-
 Uganda
-
 Ukraine
-
 United Kingdom
-
United States
-
 Uruguay
-
 Uzbekistan
-
 Venezuela
-
 Vietnam
-
 Yemen
-
 Zambia
-
 Zimbabwe
- Forex
- Crypto












