

Can Chevron stock regain momentum as rebound attempts are capped?

Chevron (CVX) stock is trading at $204.10, down 1.26% on the day. The price is currently below its short- and medium-term moving averages, but remains above its long-term trends.
 236.45
Highlights
- Chevron paid $3.5 billion in dividends and repurchased over $3.1 billion of stock in the second quarter of 2026.
- The company reduced outstanding debt by more than $8 billion and began realizing returns from Venezuela investments.
- Chevron stock faces short- and medium-term downward pressure with a 77% probability of moving in the $202.29 to $207.65 range.
Yield boost and debt reduction enhance metrics amid seller pressure
Chevron returned significant capital to shareholders in the second quarter of 2026, paying $3.5 billion in dividends and executing over $3.1 billion of share buybacks, according to Fool. These actions directly improved per-share metrics and mitigated equity dilution while enhancing the stock's yield profile. The company also reduced its outstanding debt by more than $8 billion in the same period, strengthening its balance sheet, and has begun to realize returns from its long-term investments in Venezuela as the country's oil sector reopens. Although these completed moves have improved Chevron's underlying fundamentals, price action has remained under broader selling pressure.
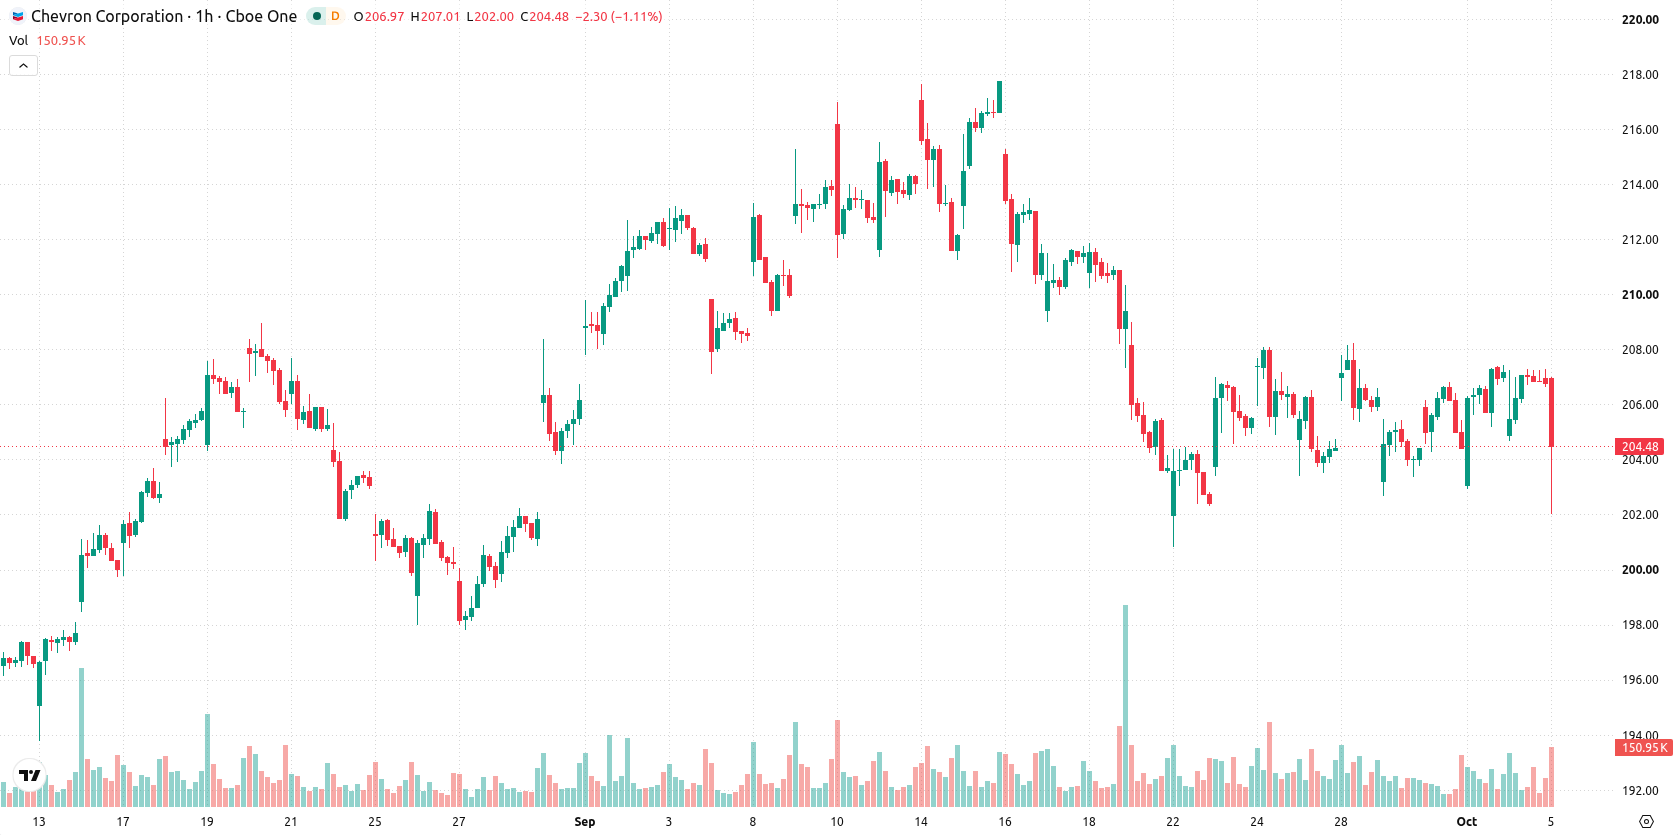
Mixed momentum signals as intraday support diverges from long-term trend
On the technical front, CVX is trading below the MA-20 and MA-50 on the hourly chart, with the daily price structure still above the MA-200. The immediate resistance is defined by the Ichimoku Kijun at $205.12. Momentum signals are mixed: MACD and Awesome Oscillator show a Buy reading, while ADX and Stochastic RSI remain on Sell. Both RSI and CCI are on Buy, with RSI near neutral levels, but Bull/Bear Power registers as overbought, pointing to underlying buyer dominance despite weak session performance.
Downside risk prevails as consolidation threatens further decline
In the short term, CVX is expected to trade between $202.29 and $207.65, representing the typical volatility band relative to current levels. The outlook favors further downside, with a 77% probability of a move lower and only a 23% chance of an upside breakout. The most likely scenario is continued sideways action within this corridor. Should the price break above the $205.12 resistance, a bullish reversal could follow, while a drop below $202.29 may trigger a deeper selloff.
Earlier, analysts noted that Chevron exhibited mixed technical momentum amid portfolio expansion, advising close attention to breakout levels for potential market direction. The current analysis adds greater weight to downside risks while highlighting $202.29 as the key support level to monitor for any acceleration of selling pressure.











-
 Afghanistan
-
 Albania
-
 Algeria
-
 Angola
-
 Argentina
-
 Armenia
-
 Australia
-
 Austria
-
 Azerbaijan
-
 Bahamas
-
 Bahrain
-
 Bangladesh
-
 Belarus
-
 Belgium
-
 Bolivia
-
 Botswana
-
 Brazil
-
 Brunei
-
 Bulgaria
-
 Cambodia
-
 Cameroon
-
 Canada
-
 Chile
-
 China
-
 Colombia
-
 Congo
-
 Costa Rica
-
 Cote d'Ivoire
-
 Croatia
-
 Cuba
-
 Cyprus
-
 Czechia
-
 DR Congo
-
 Denmark
-
 Dominican Republic
-
 Ecuador
-
 Egypt
-
 El Salvador
-
 Estonia
-
 Eswatini
-
 Ethiopia
-
 Finland
-
 France
-
 Georgia
-
 Germany
-
 Ghana
-
 Greece
-
 Haiti
-
 Hong Kong
-
 Hungary
-
 India
-
 Indonesia
-
 Iran, Islamic republic
-
 Iraq
-
 Ireland
-
 Israel
-
 Italy
-
 Jamaica
-
 Japan
-
 Jordan
-
 Kazakhstan
-
 Kenya
-
 Korea
-
 Kuwait
-
 Kyrgyzstan
-
 Laos
-
 Latvia
-
 Lebanon
-
 Lesotho
-
 Libya
-
 Lithuania
-
 Luxembourg
-
 Madagascar
-
 Malaysia
-
 Malta
-
 Mauritius
-
 Mexico
-
 Moldova
-
 Mongolia
-
 Montenegro
-
 Morocco
-
 Mozambique
-
 Myanmar
-
 Namibia
-
 Nepal
-
 Netherlands
-
 New Zealand
-
 Nigeria
-
 North Macedonia
-
 Norway
-
 Oman
-
 Pakistan
-
 Palestine
-
 Panama
-
 Papua New Guinea
-
 Paraguay
-
 Peru
-
 Philippines
-
 Poland
-
 Portugal
-
 Puerto Rico
-
 Qatar
-
 Reunion
-
 Romania
-
 Rwanda
-
 Saudi Arabia
-
 Serbia
-
 Singapore
-
 Slovakia
-
 Slovenia
-
 Somalia
-
 South Africa
-
 Spain
-
 Sri Lanka
-
 Sweden
-
 Switzerland
-
 Syria
-
 Taiwan
-
 Tajikistan
-
 Tanzania
-
 Thailand
-
 Trinidad and Tobago
-
 Tunisia
-
 Turkey
-
 UAE
-
 Uganda
-
 Ukraine
-
 United Kingdom
-
United States
-
 Uruguay
-
 Uzbekistan
-
 Venezuela
-
 Vietnam
-
 Yemen
-
 Zambia
-
 Zimbabwe
- Forex
- Crypto












