

ServiceNow shares extend recovery but face overbought risk: weekly analysis

Shares of ServiceNow (NOW) are trading near $137 after gaining around 1.6% this week, as buyers test the boundaries of a sharp recovery. Despite this recent strength, technical signals point to an overbought setup, leaving sentiment divided ahead of the next move.
 109.22
155.01
Highlights
- Shares of ServiceNow advanced 1.62% over the past week and are consolidating with recent volatility at 9.56%.
- Long-term trend remains positive with the stock above key moving averages, though momentum is mixed with some overbought signs.
- For the coming week, ServiceNow shares are expected to trade between $124.57 and $142.11, with near-term support at $136.23 and resistance at $138.23.
Institutional flows strengthen as Flow by ServiceNow launch and security issues reshape sentiment
ServiceNow launched Flow by ServiceNow, a conversational AI-native service desk aiming to boost adoption for teams of all sizes, according to Yahoo Finance, Simply Wall St, and Fortune. The Flow launch drove heightened trading interest among institutional investors, supported by reported annual revenue of $13.28 billion and net profit of $1.75 billion. Security remained a focus after NOW disclosed several critical vulnerabilities in its AI Platform, issuing an advisory for urgent client patching and announcing a new AI security partnership with Reco.
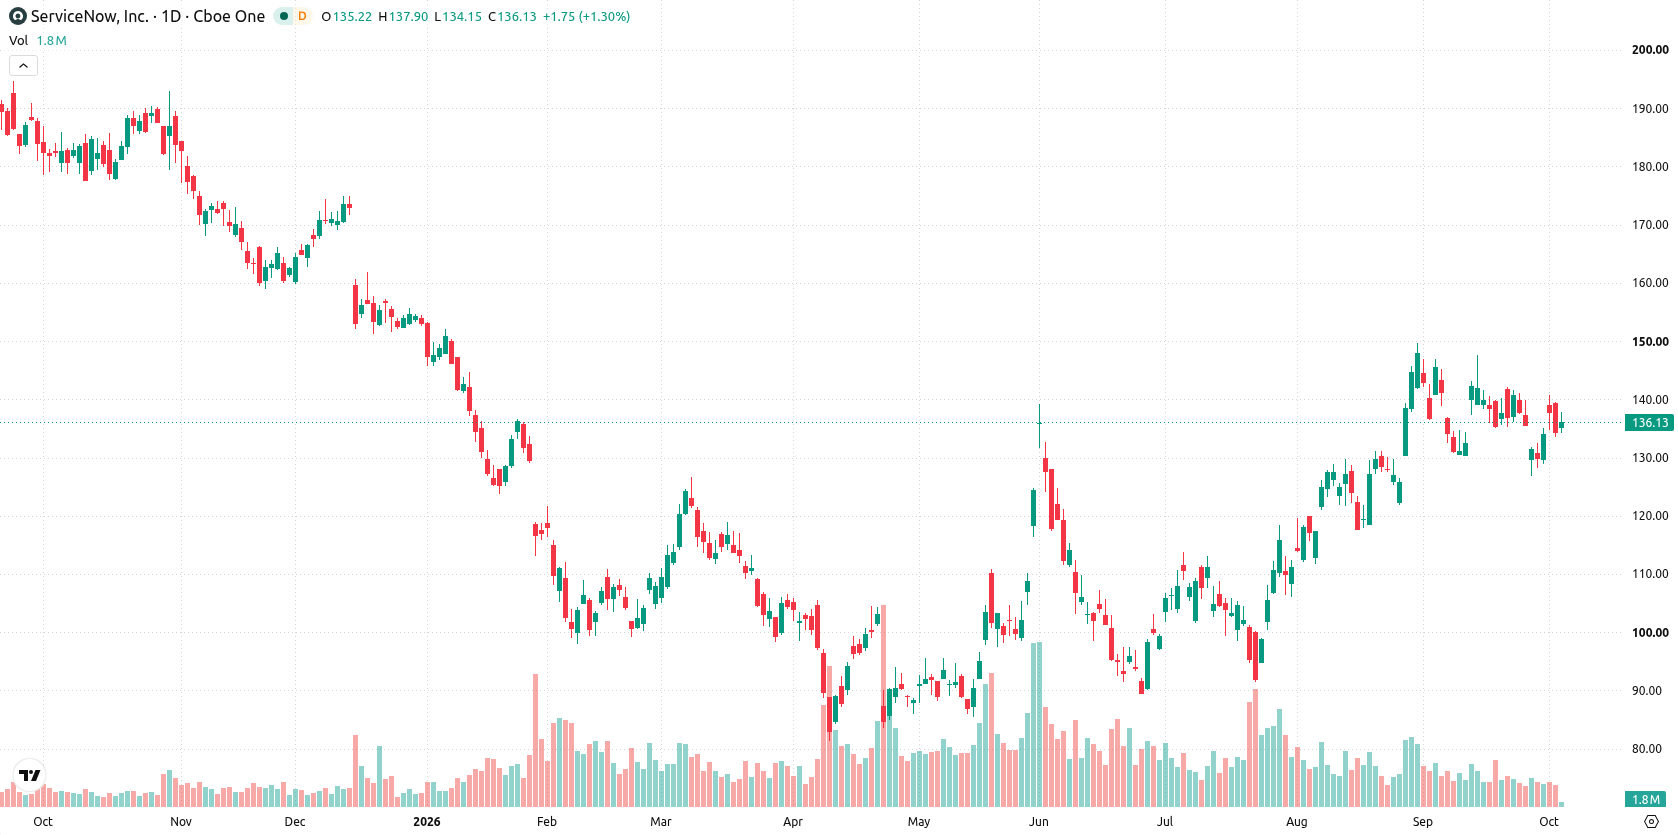
Mixed momentum signals persist as volatility rises and price consolidates
On the daily chart, the overall setup reflects consolidation with volatility over the past week at 9.56%. While MACD remains in a strong buy posture at 0.97, Bull/Bear Power points to overbought conditions, and major oscillators such as RSI (50.35) are neutral. Support is sitting at the MA-20 at $136.23, while resistance stands at $138.23 from the Ichimoku Kijun. The price action reflects a sharp move higher without a sustained trend, and momentum signals are mixed, suggesting indecision at current levels.
Breakout risk emerges in coming week amid narrow consolidation range
For the coming trading week, ServiceNow shares are expected to trade between $124.57 and $142.11, with a 48% probability of an increase and a 52% probability of a decrease. The base case sees the stock consolidating between the current support at $136.23 and resistance at $138.23. A breakout above $138.23 could open the way toward the upper end of the expected range. A break below $136.23 would place the lower end of the forecast around $124.57 in play.
Previously it was reported that ServiceNow faced persistent selling pressure as technical indicators signaled downside risk despite strong revenue growth and product launches. The current article marks a shift by highlighting a return of buying interest and mixed momentum signals, with traders advised to watch for a potential breakout above $138.23 or a pullback below $136.23 to gauge the next directional move.






Latest ServiceNow News



-
 Afghanistan
-
 Albania
-
 Algeria
-
 Angola
-
 Argentina
-
 Armenia
-
 Australia
-
 Austria
-
 Azerbaijan
-
 Bahamas
-
 Bahrain
-
 Bangladesh
-
 Belarus
-
 Belgium
-
 Bolivia
-
 Botswana
-
 Brazil
-
 Brunei
-
 Bulgaria
-
 Cambodia
-
 Cameroon
-
 Canada
-
 Chile
-
 China
-
 Colombia
-
 Congo
-
 Costa Rica
-
 Cote d'Ivoire
-
 Croatia
-
 Cuba
-
 Cyprus
-
 Czechia
-
 DR Congo
-
 Denmark
-
 Dominican Republic
-
 Ecuador
-
 Egypt
-
 El Salvador
-
 Estonia
-
 Eswatini
-
 Ethiopia
-
 Finland
-
 France
-
 Georgia
-
 Germany
-
 Ghana
-
 Greece
-
 Haiti
-
 Hong Kong
-
 Hungary
-
 India
-
 Indonesia
-
 Iran, Islamic republic
-
 Iraq
-
 Ireland
-
 Israel
-
 Italy
-
 Jamaica
-
 Japan
-
 Jordan
-
 Kazakhstan
-
 Kenya
-
 Korea
-
 Kuwait
-
 Kyrgyzstan
-
 Laos
-
 Latvia
-
 Lebanon
-
 Lesotho
-
 Libya
-
 Lithuania
-
 Luxembourg
-
 Madagascar
-
 Malaysia
-
 Malta
-
 Mauritius
-
 Mexico
-
 Moldova
-
 Mongolia
-
 Montenegro
-
 Morocco
-
 Mozambique
-
 Myanmar
-
 Namibia
-
 Nepal
-
 Netherlands
-
 New Zealand
-
 Nigeria
-
 North Macedonia
-
 Norway
-
 Oman
-
 Pakistan
-
 Palestine
-
 Panama
-
 Papua New Guinea
-
 Paraguay
-
 Peru
-
 Philippines
-
 Poland
-
 Portugal
-
 Puerto Rico
-
 Qatar
-
 Reunion
-
 Romania
-
 Rwanda
-
 Saudi Arabia
-
 Serbia
-
 Singapore
-
 Slovakia
-
 Slovenia
-
 Somalia
-
 South Africa
-
 Spain
-
 Sri Lanka
-
 Sweden
-
 Switzerland
-
 Syria
-
 Taiwan
-
 Tajikistan
-
 Tanzania
-
 Thailand
-
 Trinidad and Tobago
-
 Tunisia
-
 Turkey
-
 UAE
-
 Uganda
-
 Ukraine
-
 United Kingdom
-
United States
-
 Uruguay
-
 Uzbekistan
-
 Venezuela
-
 Vietnam
-
 Yemen
-
 Zambia
-
 Zimbabwe
- Forex
- Crypto












