

Salesforce shares drop about 2.5% after record $25 billion share repurchase and mixed technical signals

Salesforce, Inc. (CRM) fell 2.58% as short-term selling pressure overwhelmed a backdrop of corporate activity, including a record-setting $25 billion share repurchase and a strong quarterly earnings release. The down move looks limited, with the stock currently trading below its 20-day moving average but still above its 50- and 200-day averages, maintaining a medium- and long-term bullish structure.
 233.97
248.80
Highlights
- Salesforce executed half of a $50 billion buyback in February 2026 and posted adjusted Q2 EPS of $5.90 against a $3.27 consensus.
- Full-year 2027 revenue is projected at $46.1 billion to $46.4 billion, with Missionforce naming Virginia Sharma as chief marketing officer.
- Salesforce stock trades between the 50-day and 20-day averages with mixed momentum signals, a projected five-session range of $220.92 to $236.2, and a 65% probability of upside movement.
Accelerated buybacks and record earnings contrast with persistent selling
Salesforce authorized and rapidly executed half of a $50 billion share repurchase program in February 2026, marking a milestone for accelerated buybacks. The company also reported adjusted Q2 EPS of $5.90 against a $3.27 consensus and issued FY27 revenue guidance of $46.1 billion to $46.4 billion. Virginia Sharma was appointed chief marketing officer for its Missionforce unit, and ETF activity recorded $25.4 million in net purchases on October 1, though price action has remained under broader selling pressure.
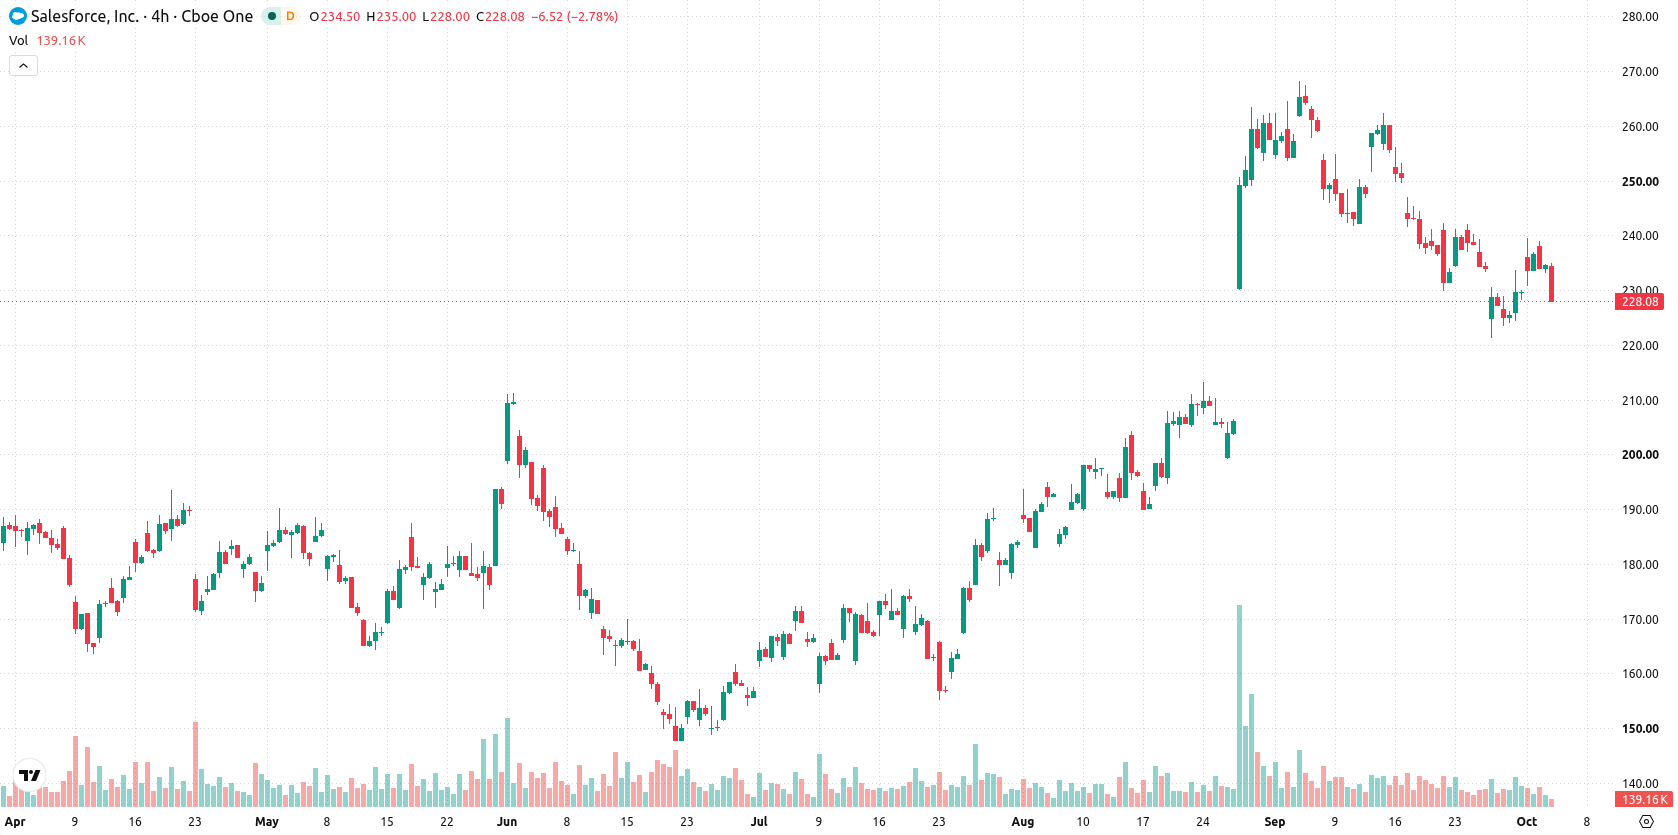
Medium-term bullish bias holds as intraday signals diverge
Salesforce is currently trading beneath the 20-day moving average at $241.17, but above the 50-day at $220.05 and 200-day at $200.49, reaffirming medium- and long-term bullish structure yet signaling short-term downside pressure. Immediate levels to watch are $233.23 as near-term ceiling and $223.51 as key floor. Momentum indicators are mixed: the Moving Average Convergence Divergence (MACD) signals strong buy, but the Average Directional Index (ADX) and Stochastic RSI suggest neutral trends, while the Relative Strength Index (RSI) remains in a buy configuration at 51.29. The Commodity Channel Index (CCI) and Awesome Oscillator (AO) both forecast sell. Bull/Bear Power (BBP) at 2.91 confirms buyers dominate intraday, with an overbought condition flagged. The stock opened with an upside gap of about $2.81, or 1.2%, then reversed lower to $228.56, down 2.58%. Price trades near the session’s low within an intraday volatility band of 2.22%. There is clear pressure following an initially bullish open, and momentum signals diverge from each other.
Earlier, analysts noted that Salesforce's medium- and long-term bullish structure was intact despite short-term volatility and mixed momentum signals. The current analysis adds a new dimension as recent buyback activity and strong earnings highlight fundamental support, with the prevailing risk skewed toward a bullish breakout if $233.23 is reclaimed.






Latest Salesforce News




-
 Afghanistan
-
 Albania
-
 Algeria
-
 Angola
-
 Argentina
-
 Armenia
-
 Australia
-
 Austria
-
 Azerbaijan
-
 Bahamas
-
 Bahrain
-
 Bangladesh
-
 Belarus
-
 Belgium
-
 Bolivia
-
 Botswana
-
 Brazil
-
 Brunei
-
 Bulgaria
-
 Cambodia
-
 Cameroon
-
 Canada
-
 Chile
-
 China
-
 Colombia
-
 Congo
-
 Costa Rica
-
 Cote d'Ivoire
-
 Croatia
-
 Cuba
-
 Cyprus
-
 Czechia
-
 DR Congo
-
 Denmark
-
 Dominican Republic
-
 Ecuador
-
 Egypt
-
 El Salvador
-
 Estonia
-
 Eswatini
-
 Ethiopia
-
 Finland
-
 France
-
 Georgia
-
 Germany
-
 Ghana
-
 Greece
-
 Haiti
-
 Hong Kong
-
 Hungary
-
 India
-
 Indonesia
-
 Iran, Islamic republic
-
 Iraq
-
 Ireland
-
 Israel
-
 Italy
-
 Jamaica
-
 Japan
-
 Jordan
-
 Kazakhstan
-
 Kenya
-
 Korea
-
 Kuwait
-
 Kyrgyzstan
-
 Laos
-
 Latvia
-
 Lebanon
-
 Lesotho
-
 Libya
-
 Lithuania
-
 Luxembourg
-
 Madagascar
-
 Malaysia
-
 Malta
-
 Mauritius
-
 Mexico
-
 Moldova
-
 Mongolia
-
 Montenegro
-
 Morocco
-
 Mozambique
-
 Myanmar
-
 Namibia
-
 Nepal
-
 Netherlands
-
 New Zealand
-
 Nigeria
-
 North Macedonia
-
 Norway
-
 Oman
-
 Pakistan
-
 Palestine
-
 Panama
-
 Papua New Guinea
-
 Paraguay
-
 Peru
-
 Philippines
-
 Poland
-
 Portugal
-
 Puerto Rico
-
 Qatar
-
 Reunion
-
 Romania
-
 Rwanda
-
 Saudi Arabia
-
 Serbia
-
 Singapore
-
 Slovakia
-
 Slovenia
-
 Somalia
-
 South Africa
-
 Spain
-
 Sri Lanka
-
 Sweden
-
 Switzerland
-
 Syria
-
 Taiwan
-
 Tajikistan
-
 Tanzania
-
 Thailand
-
 Trinidad and Tobago
-
 Tunisia
-
 Turkey
-
 UAE
-
 Uganda
-
 Ukraine
-
 United Kingdom
-
United States
-
 Uruguay
-
 Uzbekistan
-
 Venezuela
-
 Vietnam
-
 Yemen
-
 Zambia
-
 Zimbabwe
- Forex
- Crypto












