

Hain Celestial stock climbs almost 5% after technical rebound despite bearish structure

The Hain Celestial Group (HAIN) advanced 4.74% as upward intraday momentum fueled a test of session highs in the absence of a fresh catalyst. The rebound looks limited, with Hain Celestial still trading below its 20-day, 50-day, and 200-day moving averages.
 0.1355
0.1618
Highlights
- Shares of Hain Celestial trade below key short- and long-term moving averages, indicating a persistent bearish structure.
- Technical indicators show selling pressure has not reached oversold conditions, with weak trend strength and no clear conviction.
- The projected range for the next five sessions is $0.51 to $0.58, with a 76% probability of further downside.
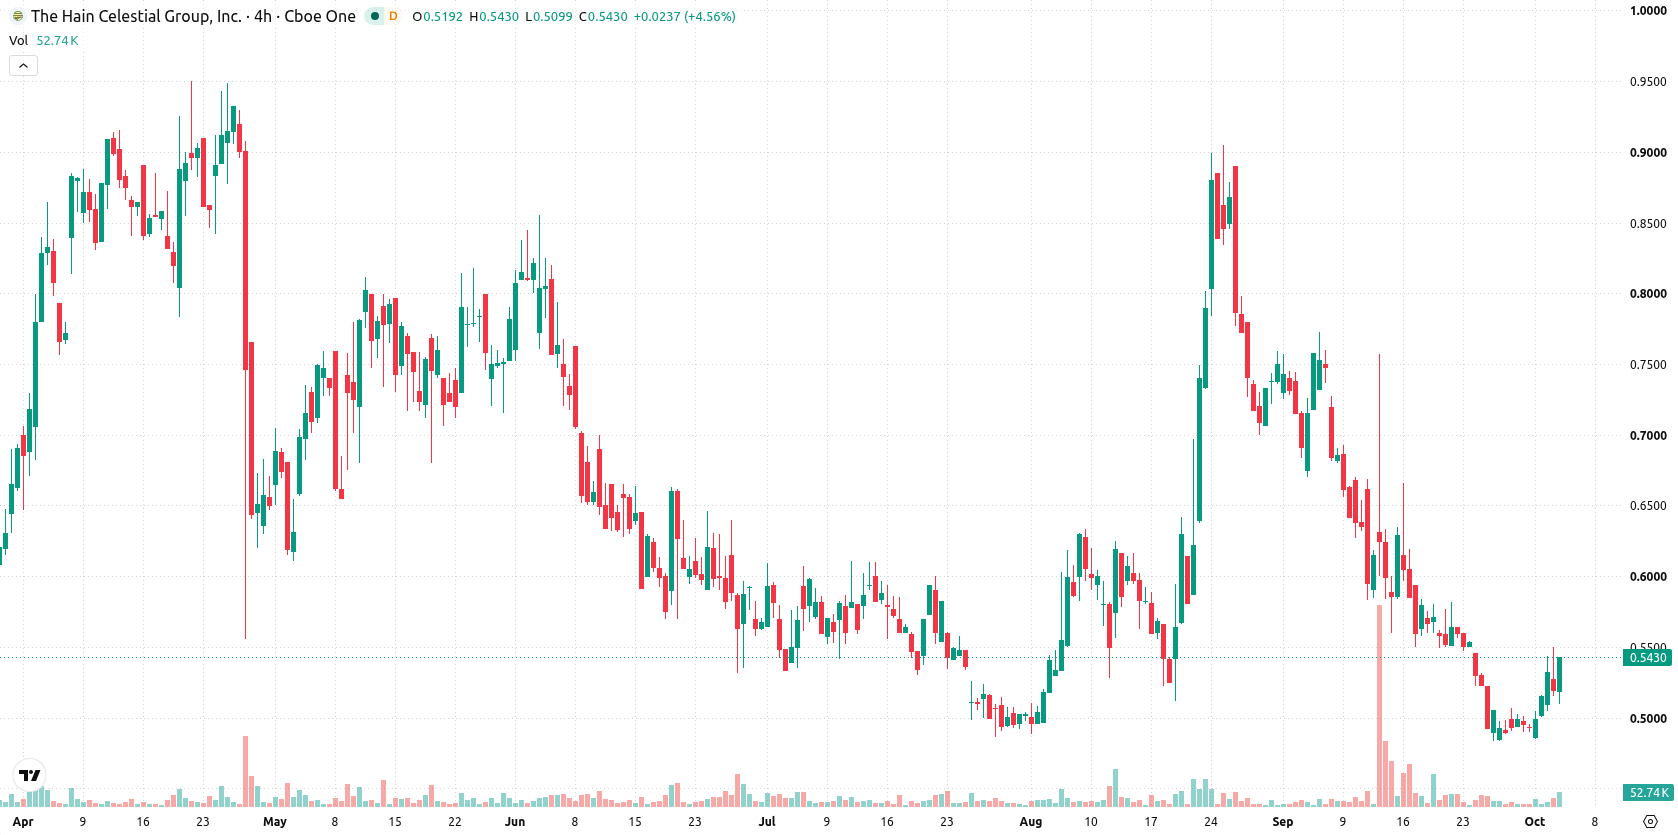
Bearish technical bias confirmed as momentum signals diverge
Hain Celestial is trading below its 20-day, 50-day, and 200-day moving averages ($0.57, $0.6, and $0.77, respectively), reinforcing persistent pressure from sellers across all timeframes. The near-term ceiling remains at $0.54, with the near-term floor identified at $0.51, and the overall moving average alignment points to a bearish structure. Momentum indicators are sending mixed signals: the Moving Average Convergence Divergence (MACD) is in a sell mode, and the Average Directional Index (ADX) sits at neutral, while the Relative Strength Index (RSI) at 39.2 and Commodity Channel Index (CCI) at -64.18 suggest ongoing selling pressure and no oversold condition yet. Stochastic RSI is neutral at 45.63, and Bull/Bear Power (BBP) slightly above zero indicates buyers have a marginal edge intraday. The stock is up $0.0245, a 4.74% gain, opening nearly flat and now trading near the session high, with intraday volatility at 6.79%. Action has shown strength toward the session highs, yet daily and underlying momentum signals diverge, suggesting a lack of clear conviction.
Earlier, analysts noted that entrenched bearish momentum and persistent technical weakness continued to weigh on Hain Celestial’s price action. The present analysis reinforces this bearish bias, highlighting that traders should closely monitor the $0.51 support as sustained downside volatility may accelerate if this level is breached.






Latest The Hain Celestial Group News




-
 Afghanistan
-
 Albania
-
 Algeria
-
 Angola
-
 Argentina
-
 Armenia
-
 Australia
-
 Austria
-
 Azerbaijan
-
 Bahamas
-
 Bahrain
-
 Bangladesh
-
 Belarus
-
 Belgium
-
 Bolivia
-
 Botswana
-
 Brazil
-
 Brunei
-
 Bulgaria
-
 Cambodia
-
 Cameroon
-
 Canada
-
 Chile
-
 China
-
 Colombia
-
 Congo
-
 Costa Rica
-
 Cote d'Ivoire
-
 Croatia
-
 Cuba
-
 Cyprus
-
 Czechia
-
 DR Congo
-
 Denmark
-
 Dominican Republic
-
 Ecuador
-
 Egypt
-
 El Salvador
-
 Estonia
-
 Eswatini
-
 Ethiopia
-
 Finland
-
 France
-
 Georgia
-
 Germany
-
 Ghana
-
 Greece
-
 Haiti
-
 Hong Kong
-
 Hungary
-
 India
-
 Indonesia
-
 Iran, Islamic republic
-
 Iraq
-
 Ireland
-
 Israel
-
 Italy
-
 Jamaica
-
 Japan
-
 Jordan
-
 Kazakhstan
-
 Kenya
-
 Korea
-
 Kuwait
-
 Kyrgyzstan
-
 Laos
-
 Latvia
-
 Lebanon
-
 Lesotho
-
 Libya
-
 Lithuania
-
 Luxembourg
-
 Madagascar
-
 Malaysia
-
 Malta
-
 Mauritius
-
 Mexico
-
 Moldova
-
 Mongolia
-
 Montenegro
-
 Morocco
-
 Mozambique
-
 Myanmar
-
 Namibia
-
 Nepal
-
 Netherlands
-
 New Zealand
-
 Nigeria
-
 North Macedonia
-
 Norway
-
 Oman
-
 Pakistan
-
 Palestine
-
 Panama
-
 Papua New Guinea
-
 Paraguay
-
 Peru
-
 Philippines
-
 Poland
-
 Portugal
-
 Puerto Rico
-
 Qatar
-
 Reunion
-
 Romania
-
 Rwanda
-
 Saudi Arabia
-
 Serbia
-
 Singapore
-
 Slovakia
-
 Slovenia
-
 Somalia
-
 South Africa
-
 Spain
-
 Sri Lanka
-
 Sweden
-
 Switzerland
-
 Syria
-
 Taiwan
-
 Tajikistan
-
 Tanzania
-
 Thailand
-
 Trinidad and Tobago
-
 Tunisia
-
 Turkey
-
 UAE
-
 Uganda
-
 Ukraine
-
 United Kingdom
-
United States
-
 Uruguay
-
 Uzbekistan
-
 Venezuela
-
 Vietnam
-
 Yemen
-
 Zambia
-
 Zimbabwe
- Forex
- Crypto












