

Why is Hut 8 stock up today? Trading near session highs outperforms recent trends; Resistance levels in focus

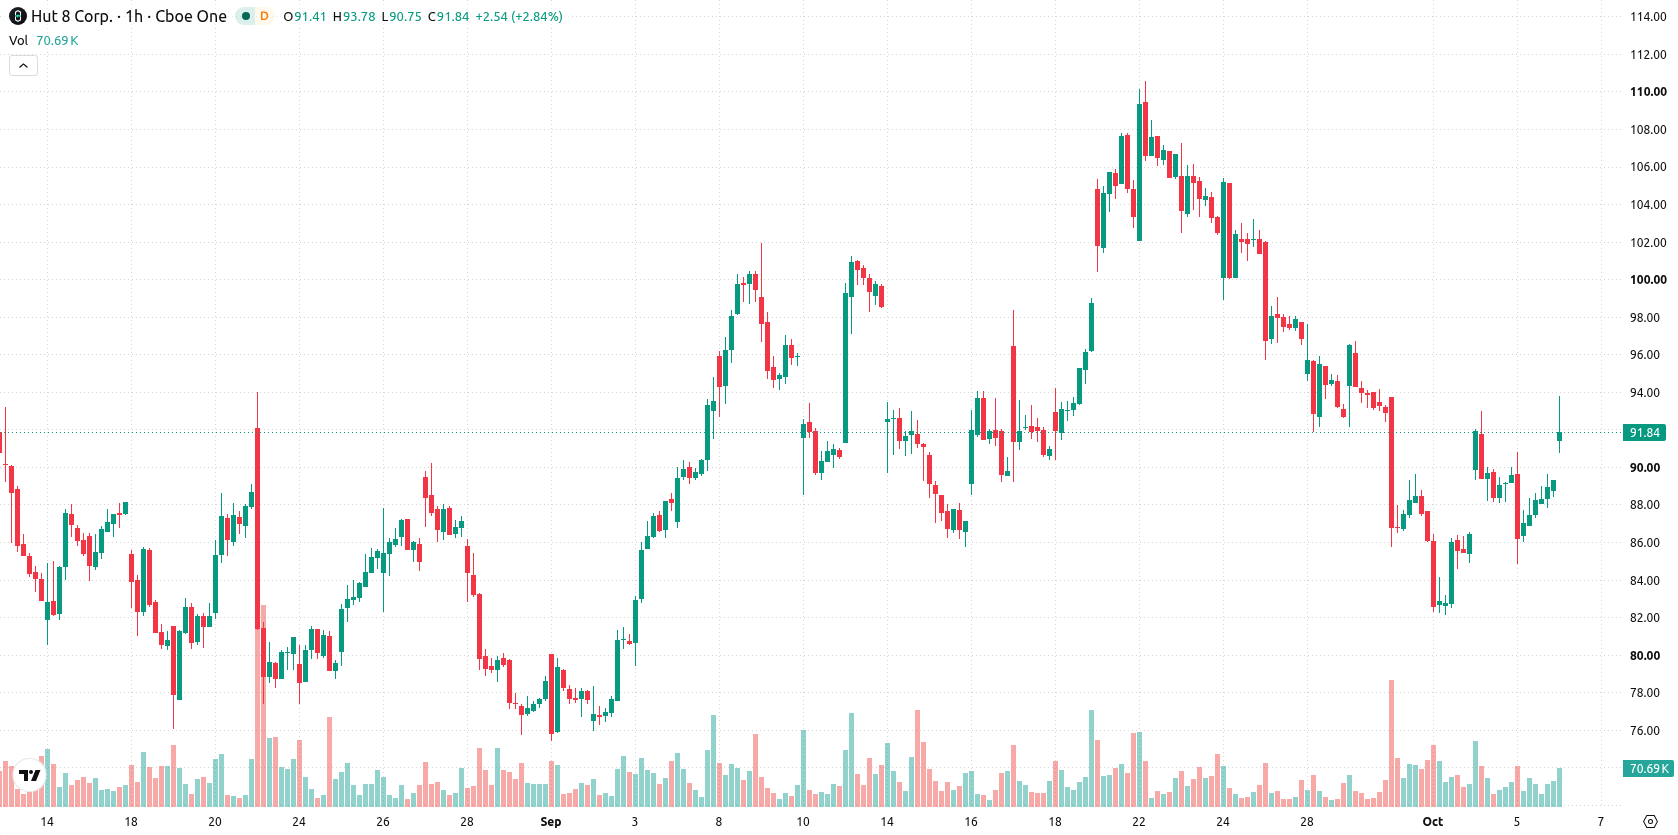
Hut 8 (HUT) stock is trading at $91.44, up 2.58% for the day and near its intraday high. The stock is currently positioned above its key moving averages, indicating notable strength relative to recent price trends.
 58.31
57.21
Highlights
- Recent price movements in shares of Hut 8 Mining are influencing adjustments in institutional trading algorithms, increasing market activity.
- Alignment with institutional trading models can generate additional order flow and may support ongoing upward price momentum.
- Hut 8 Mining trades in a bullish trend across timeframes, with the next range projected at $86.43 to $96.45 and momentum signals mixed.
Order flow rises as institutional trading models respond to price action
The recent price action of Hut 8 Mining Corp. (HUT) has been noted as influencing the setup of institutional trading models, according to News Stocktradersdaily. As institutional players adjust their algorithmic strategies based on this observed behavior, trading flows can shift, amplifying market activity. This alignment with institutional models often underpins increased order flow and can act as a catalyst for continued upward movement.
Mixed momentum signals as technicals diverge from price strength
The hourly chart shows HUT trading above the MA-20 at $87.58 and MA-50 at $90.93, with the daily chart also keeping price above the MA-200 at $80.51. The Ichimoku Kijun sits at $87.55, providing the closest support. Indicator signals are mixed: MACD shows strong selling pressure while ADX points to a bias on the downside. RSI is at 51.38 with a Buy signal, Stoch RSI is Neutral, and CCI indicates a Buy. Bull/Bear Power is flagged as Overbought, reflecting current intraday buyer dominance, while AO remains Neutral and offers no additional trend confirmation. The oscillators and momentum signals present a divergent technical backdrop compared to the upward price action.
Balanced breakout risk as price consolidates within volatility band
Looking ahead to the next several sessions, HUT is projected to fluctuate within the $86.43–$96.45 volatility band relative to current levels. Both upward and downward breakout probabilities are evenly balanced at 50%. Most likely, price action will remain sideways inside this range. A bullish development would materialize on a sustained move above $96.45, while a drop below $86.43 could open the way to further downside pressure.
Earlier, analysts noted that Hut 8 faced ongoing technical headwinds, with mixed momentum signals leading to a cautious outlook. The current technical setup adds a new dimension by highlighting increased alignment with institutional trading models, which could amplify order flow and make a sustained breakout above $96.45 a key level to monitor in the sessions ahead.











-
 Afghanistan
-
 Albania
-
 Algeria
-
 Angola
-
 Argentina
-
 Armenia
-
 Australia
-
 Austria
-
 Azerbaijan
-
 Bahamas
-
 Bahrain
-
 Bangladesh
-
 Belarus
-
 Belgium
-
 Bolivia
-
 Botswana
-
 Brazil
-
 Brunei
-
 Bulgaria
-
 Cambodia
-
 Cameroon
-
 Canada
-
 Chile
-
 China
-
 Colombia
-
 Congo
-
 Costa Rica
-
 Cote d'Ivoire
-
 Croatia
-
 Cuba
-
 Cyprus
-
 Czechia
-
 DR Congo
-
 Denmark
-
 Dominican Republic
-
 Ecuador
-
 Egypt
-
 El Salvador
-
 Estonia
-
 Eswatini
-
 Ethiopia
-
 Finland
-
 France
-
 Georgia
-
 Germany
-
 Ghana
-
 Greece
-
 Haiti
-
 Hong Kong
-
 Hungary
-
 India
-
 Indonesia
-
 Iran, Islamic republic
-
 Iraq
-
 Ireland
-
 Israel
-
 Italy
-
 Jamaica
-
 Japan
-
 Jordan
-
 Kazakhstan
-
 Kenya
-
 Korea
-
 Kuwait
-
 Kyrgyzstan
-
 Laos
-
 Latvia
-
 Lebanon
-
 Lesotho
-
 Libya
-
 Lithuania
-
 Luxembourg
-
 Madagascar
-
 Malaysia
-
 Malta
-
 Mauritius
-
 Mexico
-
 Moldova
-
 Mongolia
-
 Montenegro
-
 Morocco
-
 Mozambique
-
 Myanmar
-
 Namibia
-
 Nepal
-
 Netherlands
-
 New Zealand
-
 Nigeria
-
 North Macedonia
-
 Norway
-
 Oman
-
 Pakistan
-
 Palestine
-
 Panama
-
 Papua New Guinea
-
 Paraguay
-
 Peru
-
 Philippines
-
 Poland
-
 Portugal
-
 Puerto Rico
-
 Qatar
-
 Reunion
-
 Romania
-
 Rwanda
-
 Saudi Arabia
-
 Serbia
-
 Singapore
-
 Slovakia
-
 Slovenia
-
 Somalia
-
 South Africa
-
 Spain
-
 Sri Lanka
-
 Sweden
-
 Switzerland
-
 Syria
-
 Taiwan
-
 Tajikistan
-
 Tanzania
-
 Thailand
-
 Trinidad and Tobago
-
 Tunisia
-
 Turkey
-
 UAE
-
 Uganda
-
 Ukraine
-
 United Kingdom
-
United States
-
 Uruguay
-
 Uzbekistan
-
 Venezuela
-
 Vietnam
-
 Yemen
-
 Zambia
-
 Zimbabwe
- Forex
- Crypto












