

Manulife Financial stock price prediction: Consolidation near support

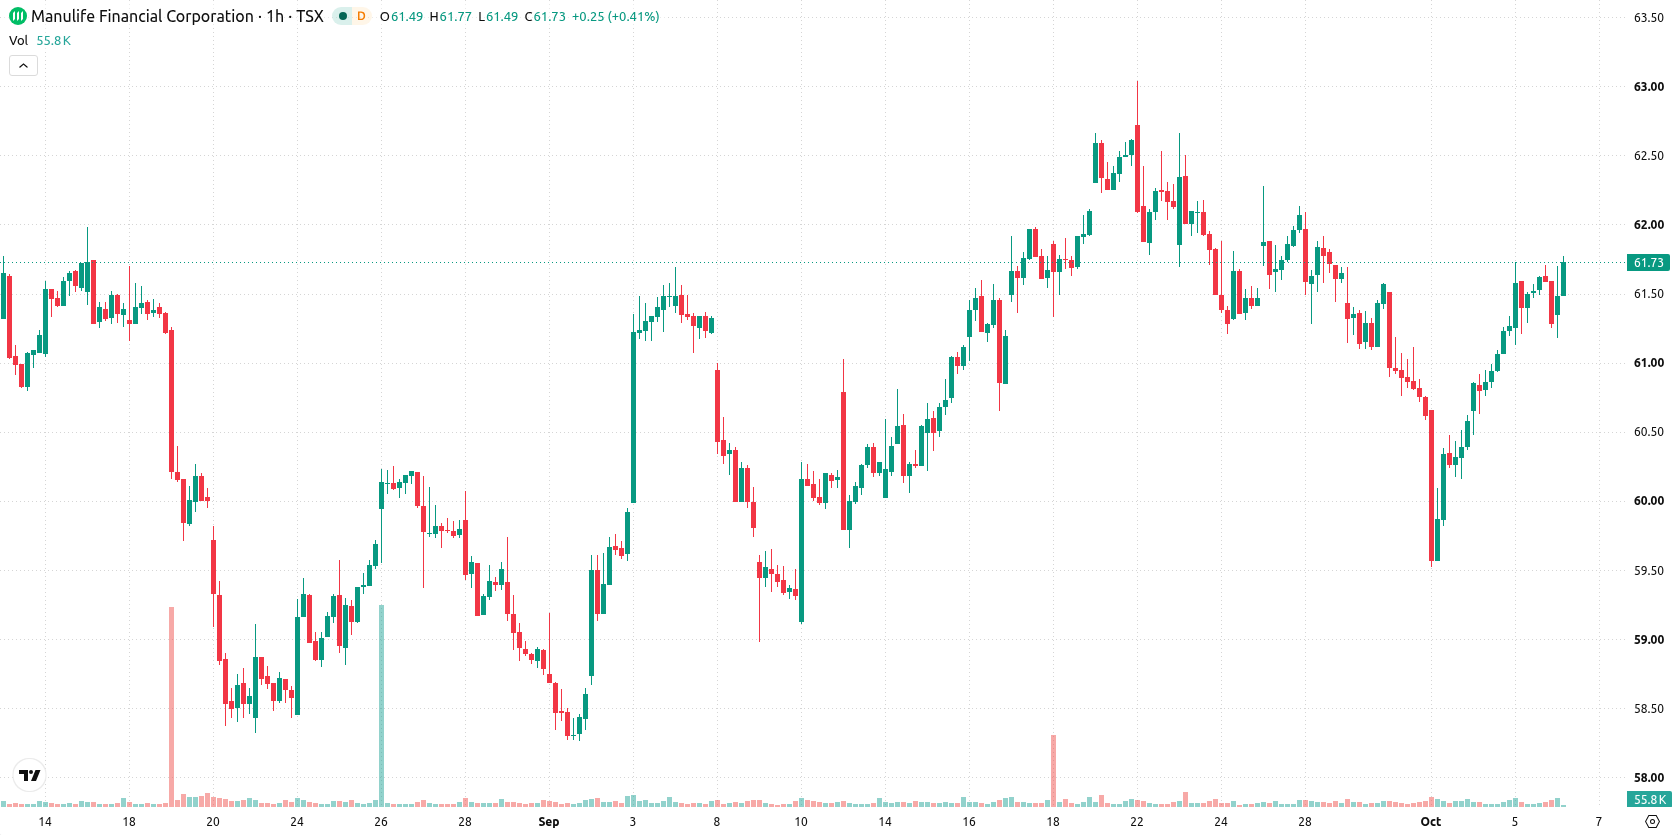
Manulife Financial (MFC) stock is trading at C$61.78 after a modest upward move on the day. The price sits above its key moving averages, with intraday activity concentrated near session highs and subdued volatility.
 62.51
63.44
Highlights
- Manulife Financial reported a strong LICAT ratio of 136% and leverage below medium-term targets, confirming robust capital strength.
- The company returned $1.4 billion to shareholders in the quarter through dividends and share buybacks, increasing shareholder liquidity.
- Shares of Manulife trade in a bullish trend above key averages, with an expected range of C$60.81 to C$62.75 over the next few days.
Buy-side demand rises as capital metrics and ESG drive sentiment
Manulife Financial's recent earnings report for the second quarter of 2026 emphasized a strong capital foundation, featuring a LICAT ratio of 136% and leverage well below medium-term goals, reflecting robust financial resilience. The company returned $1.4 billion to shareholders in the quarter through dividends and share buybacks, directly contributing to shareholder liquidity and boosting buy-side interest, according to Benzinga. Additionally, Manulife announced a two-year presenting partnership for The Hinton Lectures™ on AI safety, supporting responsible technology adoption as highlighted by Prnewswire, further expanding its engagement with ESG-oriented initiatives.
Momentum signals mixed as MFC trades above critical supports
On the technical front, MFC is positioned above the MA-20 at C$61.03 and MA-50 at C$61.2 on the hourly chart, and well above the long-term MA-200 at C$54.47 on the daily timeframe. Immediate support is identified at the Ichimoku Kijun level of C$60.62. MACD currently signals a buy, while ADX remains neutral, indicating the trend does not have strong conviction. RSI is at 54.98 with a mild upward bias, and CCI also supports a buy, though neither is in overbought territory; Stochastic RSI remains neutral. Bull/Bear Power shows strong buyer dominance, whereas the Awesome Oscillator is neutral, indicating momentum signals are positive but somewhat mixed.
Consolidation outlook dominates as upside odds remain strong
Looking ahead to the next few trading days, the price is expected to remain within a C$60.81 to C$62.75 corridor, reflecting typical volatility around current levels. The baseline scenario is for MFC to consolidate sideways within this band. A bullish scenario would see the stock break out above resistance toward the upper end of the range, while a bearish outcome would involve a move below immediate support, potentially testing C$60.81. The probability of an upward move remains significantly higher than the likelihood of a decline in the near term.
Earlier, analysts noted that Manulife stock was likely to consolidate within a defined band as technical signals remained neutral and capital returns were largely absorbed by the market. The current analysis affirms this outlook with updated technicals and recent capital actions, highlighting C$62.75 as the key resistance level to monitor for signs of a bullish breakout in the near term.






Latest Manulife Financial News




-
 Afghanistan
-
 Albania
-
 Algeria
-
 Angola
-
 Argentina
-
 Armenia
-
 Australia
-
 Austria
-
 Azerbaijan
-
 Bahamas
-
 Bahrain
-
 Bangladesh
-
 Belarus
-
 Belgium
-
 Bolivia
-
 Botswana
-
 Brazil
-
 Brunei
-
 Bulgaria
-
 Cambodia
-
 Cameroon
-
 Canada
-
 Chile
-
 China
-
 Colombia
-
 Congo
-
 Costa Rica
-
 Cote d'Ivoire
-
 Croatia
-
 Cuba
-
 Cyprus
-
 Czechia
-
 DR Congo
-
 Denmark
-
 Dominican Republic
-
 Ecuador
-
 Egypt
-
 El Salvador
-
 Estonia
-
 Eswatini
-
 Ethiopia
-
 Finland
-
 France
-
 Georgia
-
 Germany
-
 Ghana
-
 Greece
-
 Haiti
-
 Hong Kong
-
 Hungary
-
 India
-
 Indonesia
-
 Iran, Islamic republic
-
 Iraq
-
 Ireland
-
 Israel
-
 Italy
-
 Jamaica
-
 Japan
-
 Jordan
-
 Kazakhstan
-
 Kenya
-
 Korea
-
 Kuwait
-
 Kyrgyzstan
-
 Laos
-
 Latvia
-
 Lebanon
-
 Lesotho
-
 Libya
-
 Lithuania
-
 Luxembourg
-
 Madagascar
-
 Malaysia
-
 Malta
-
 Mauritius
-
 Mexico
-
 Moldova
-
 Mongolia
-
 Montenegro
-
 Morocco
-
 Mozambique
-
 Myanmar
-
 Namibia
-
 Nepal
-
 Netherlands
-
 New Zealand
-
 Nigeria
-
 North Macedonia
-
 Norway
-
 Oman
-
 Pakistan
-
 Palestine
-
 Panama
-
 Papua New Guinea
-
 Paraguay
-
 Peru
-
 Philippines
-
 Poland
-
 Portugal
-
 Puerto Rico
-
 Qatar
-
 Reunion
-
 Romania
-
 Rwanda
-
 Saudi Arabia
-
 Serbia
-
 Singapore
-
 Slovakia
-
 Slovenia
-
 Somalia
-
 South Africa
-
 Spain
-
 Sri Lanka
-
 Sweden
-
 Switzerland
-
 Syria
-
 Taiwan
-
 Tajikistan
-
 Tanzania
-
 Thailand
-
 Trinidad and Tobago
-
 Tunisia
-
 Turkey
-
 UAE
-
 Uganda
-
 Ukraine
-
 United Kingdom
-
United States
-
 Uruguay
-
 Uzbekistan
-
 Venezuela
-
 Vietnam
-
 Yemen
-
 Zambia
-
 Zimbabwe
- Forex
- Crypto












